
Tracking London's traffic congestion
Traffic congestion disrupts essential journeys and creates unpleasant places to walk and cycle, making it difficult to discourage car use as London emerges from lockdown.
Environmental Defense Fund Europe (EDF Europe) is analysing data from the Waze for Cities Programme to better understand traffic congestion across the city.
Year on year congestion difference outside and in Central London
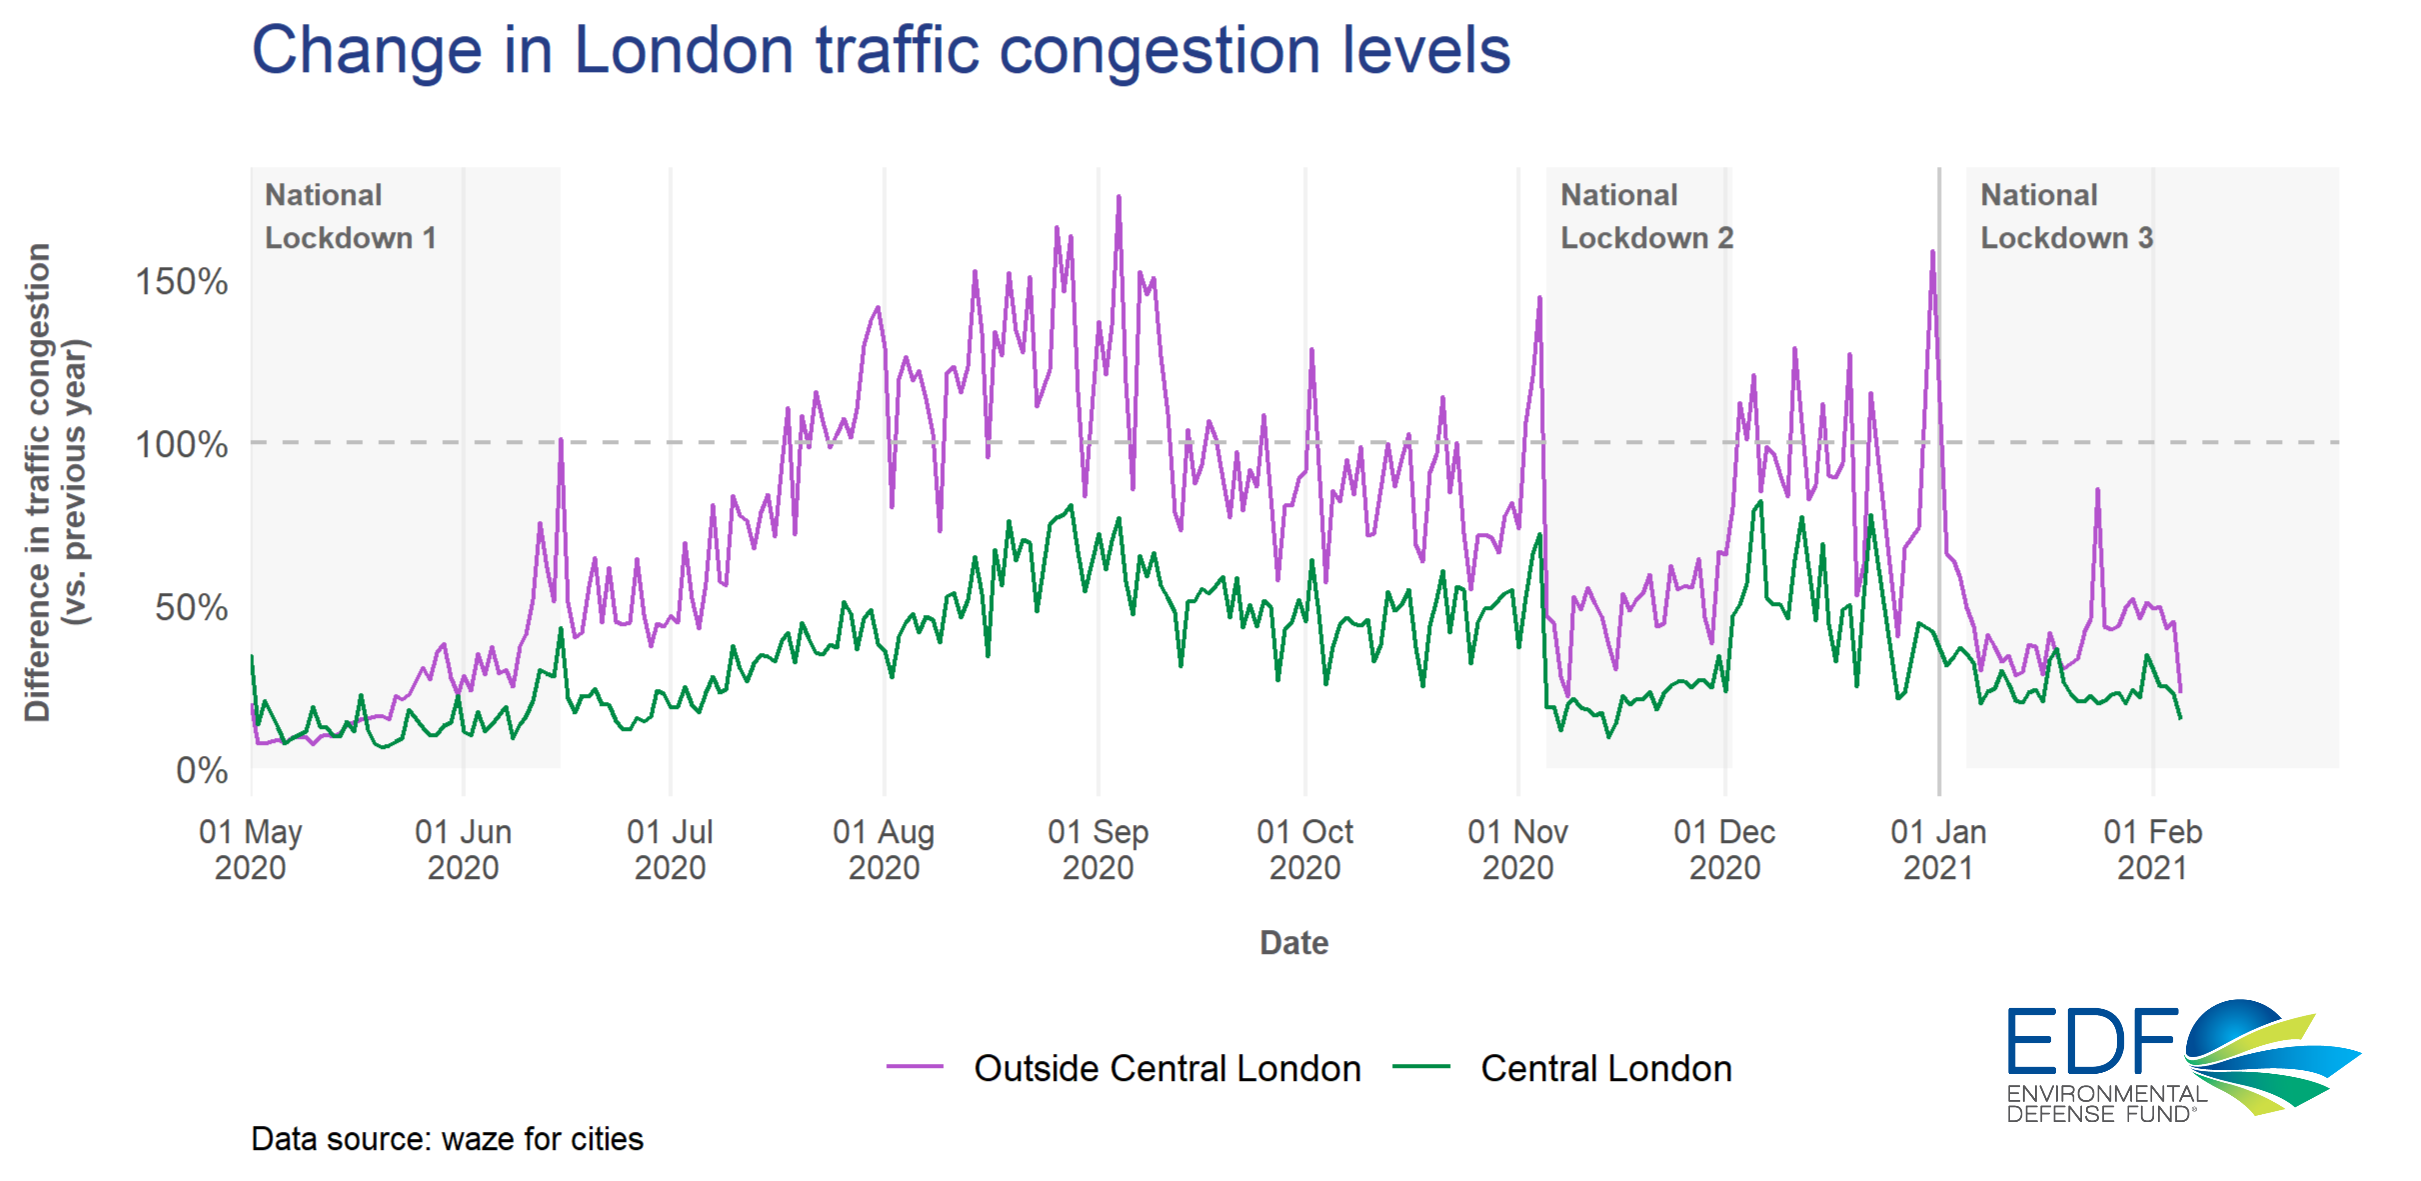
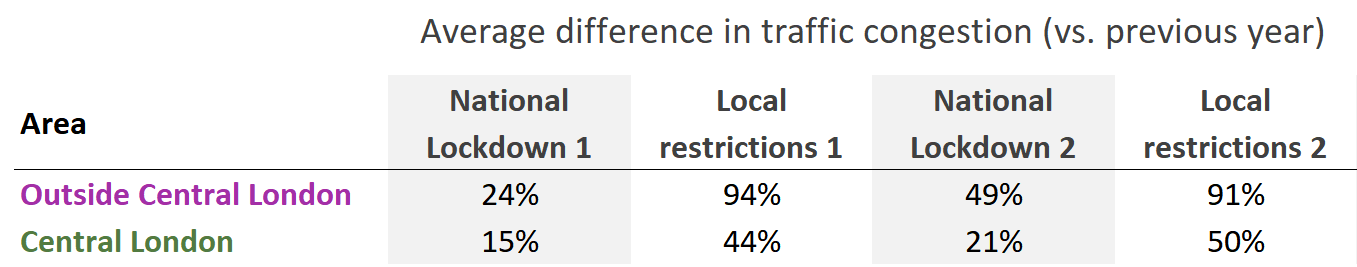
Overall, the reductions in traffic congestion during the second national lockdown were not as dramatic as those observed during the first; congestion levels outside Central London were at 49% of 2019 levels during the second compared to 24% during the first.
Since the start of the third lockdown, on 5th Jan 2021, the average difference in traffic congestion against the previous year was 40% outside central London and 25% inside central London as of 5th Feb 2021.
Methodology
Traffic data (source: Waze For Cities Programme by permission). Waze congestion alerts are created through a combination of user-generated reports and geolocation data from the million monthly active Waze users in London. A daily measure of traffic congestion for the period of interest was calculated by summing the hourly average length of all unique congestion incidents in Greater London, split into Central London and outside Central London areas. We define a congested road segment as one exhibiting 80% or less of each road’s free flow speed. Note that this data represents unique traffic congestion based on Waze-generated anonymous incident and slow-down information, and should thus be considered as an indicator of overall congestion rather than a true measure.
The year-on-year comparison of this indicator is made by matching each day in 2020 to the equivalent day in 2019 using an offset day-of-year number, ensuring that the same days of the week are matched together. Note that this method means some non-holiday days in 2020 end up being compared to holiday days in 2019, and vice-versa, which can cause a misleading spike or drop in the percentage difference. For this reason bank holiday days have been removed from the chart.
To calculate the year-on-year percentage difference for the latest week, the average daily measure of traffic length was compared between 2019 and 2020, and each London area.
For more on our analysis released 15th September, see here.