
A new analysis from Breathe London shows there has been a recent drop of harmful nitrogen dioxide (NO2) pollution, which is associated with heart and lung-related health impacts.
Hyperlocal data can help us better understand pollution changes in the UK capital. Following Covid-19 confinement measures, the Breathe London analysis sheds new light on where, when and why NO2 pollution levels in the city have gone down.
Greater pollution reductions in Central London
Breathe London is a collaborative pilot project to paint a picture of the city’s air quality, mapping pollution through a network of lower-cost sensors. Along with our partners, we assessed data from these sensors using mid-March as a starting comparison point – i.e. when the Government put in place restrictive measures to protect people’s health by slowing the spread of Covid-19.
In comparison to pre-confinement levels*, Breathe London monitors registered a 9-17% drop in NO2 pollution across the network. But this reduction is not consistent throughout the city.
The Breathe London network contains a number of sensors in Central London inside the boundaries of the Ultra Low Emission Zone (ULEZ), where more polluting vehicles are charged for entering the city centre – a charge that is currently on hold “to ensure London's critical workers are able to travel round London in the way that best suits them.”
Zooming in on the city centre, we found the monitors show a much greater reduction – an average 20-24% drop in NO2 pollution.
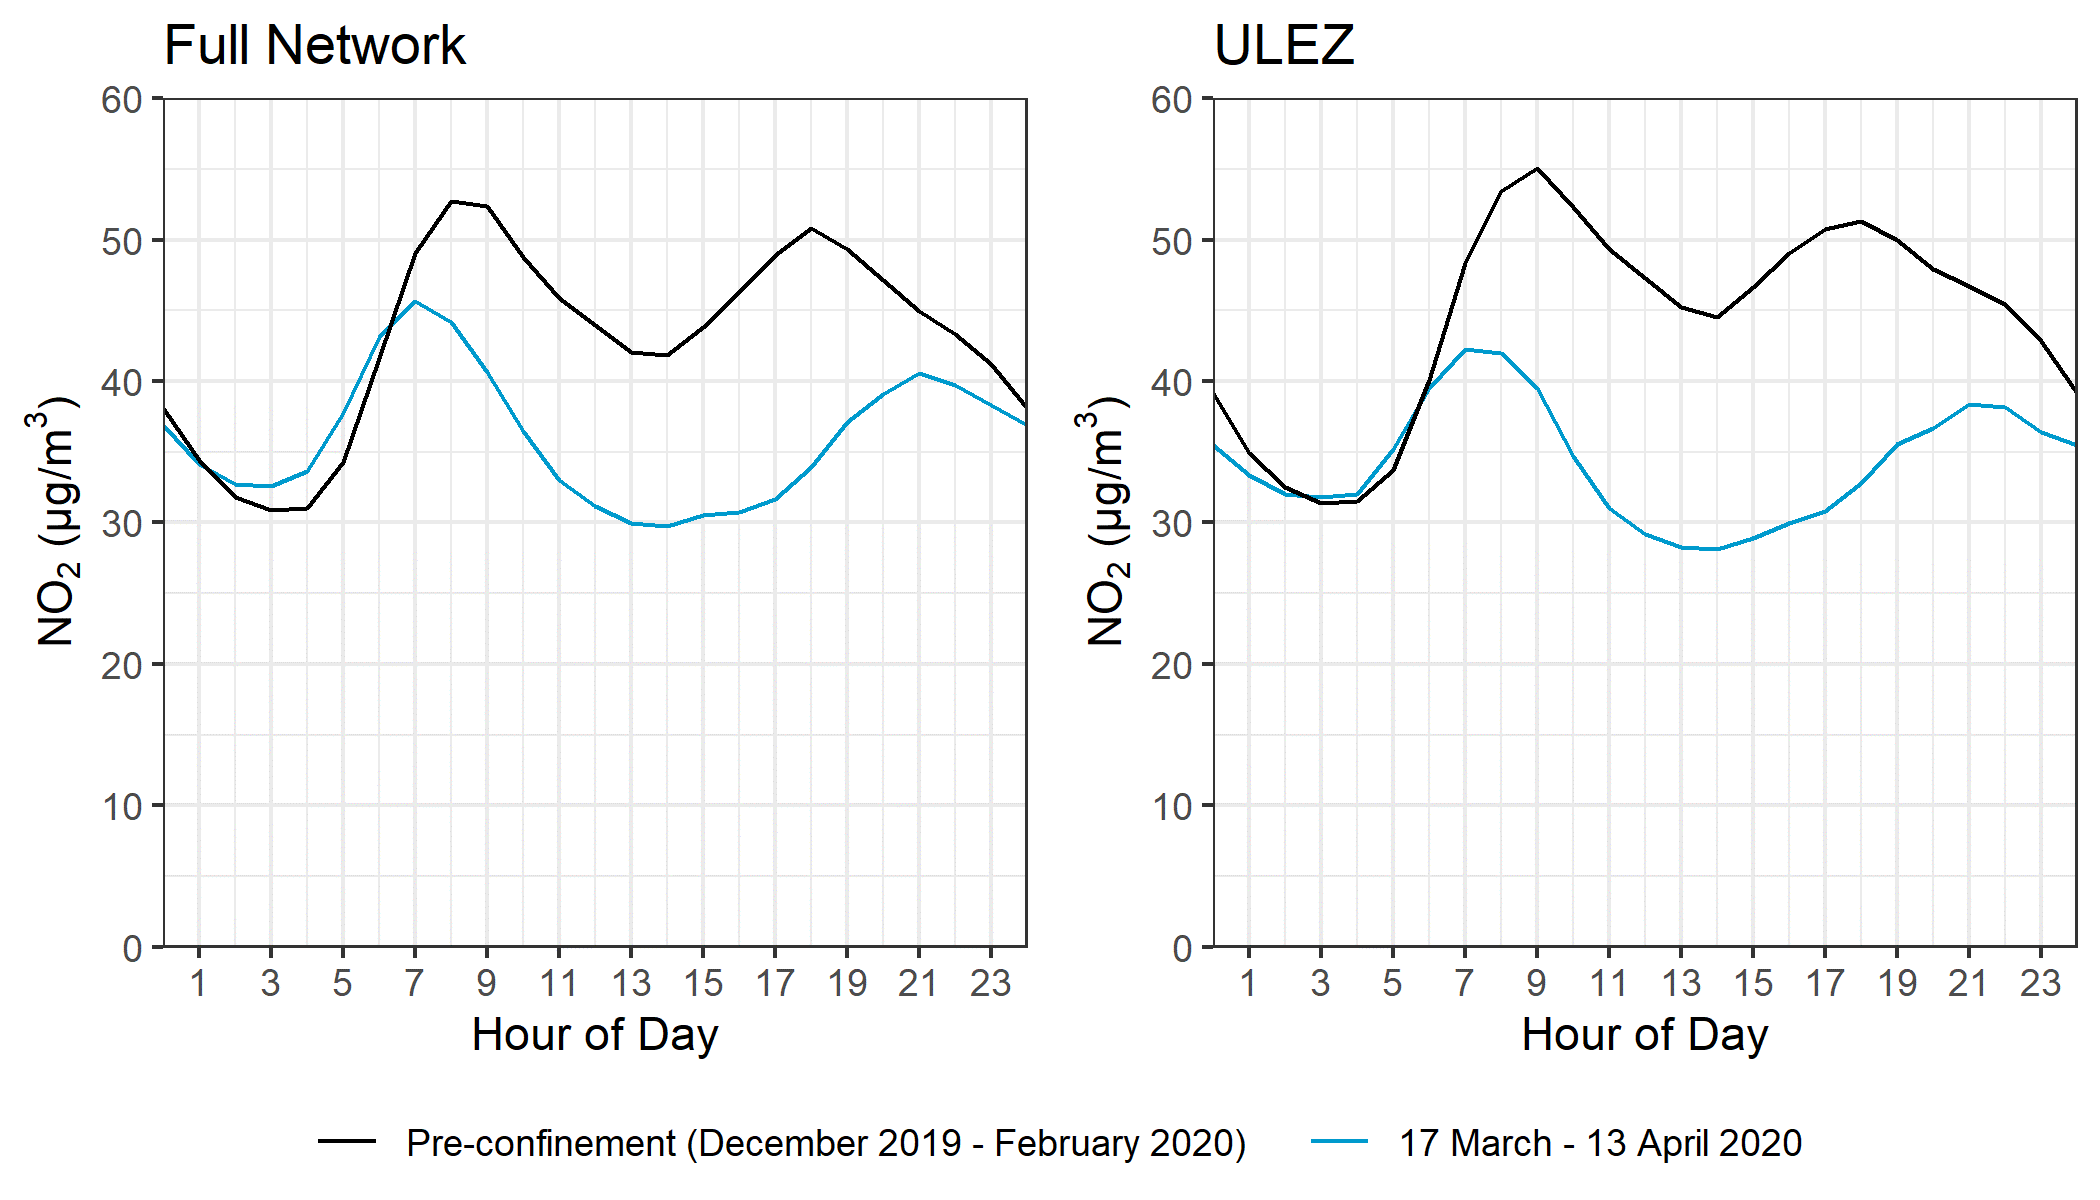
Breathe London network hourly mean NO2 measurements during 17 March to 13 April 2020 compared to pre-confinement levels.
Greater pollution reductions in the daytime
We then looked to see how the pollution levels changed throughout the day, and found that the greatest reductions occur during most people’s waking hours. Between 6 am and 10 pm, average NO2 reductions are 17-24% for the entire network, and 28-30% in Central London.
People who need to be out and about are likely doing their activities – commuting to and from their essential work, exercising and food shopping – during these hours, meaning the daytime drop in pollution reduces the potential health impacts from NO2 exposure.
When we looked at the nighttime, however, we did not find this level of reduction. At some times of the evening, we even saw a slight increase in NO2 pollution, which may be the result of weather conditions that cause pollution to build up.
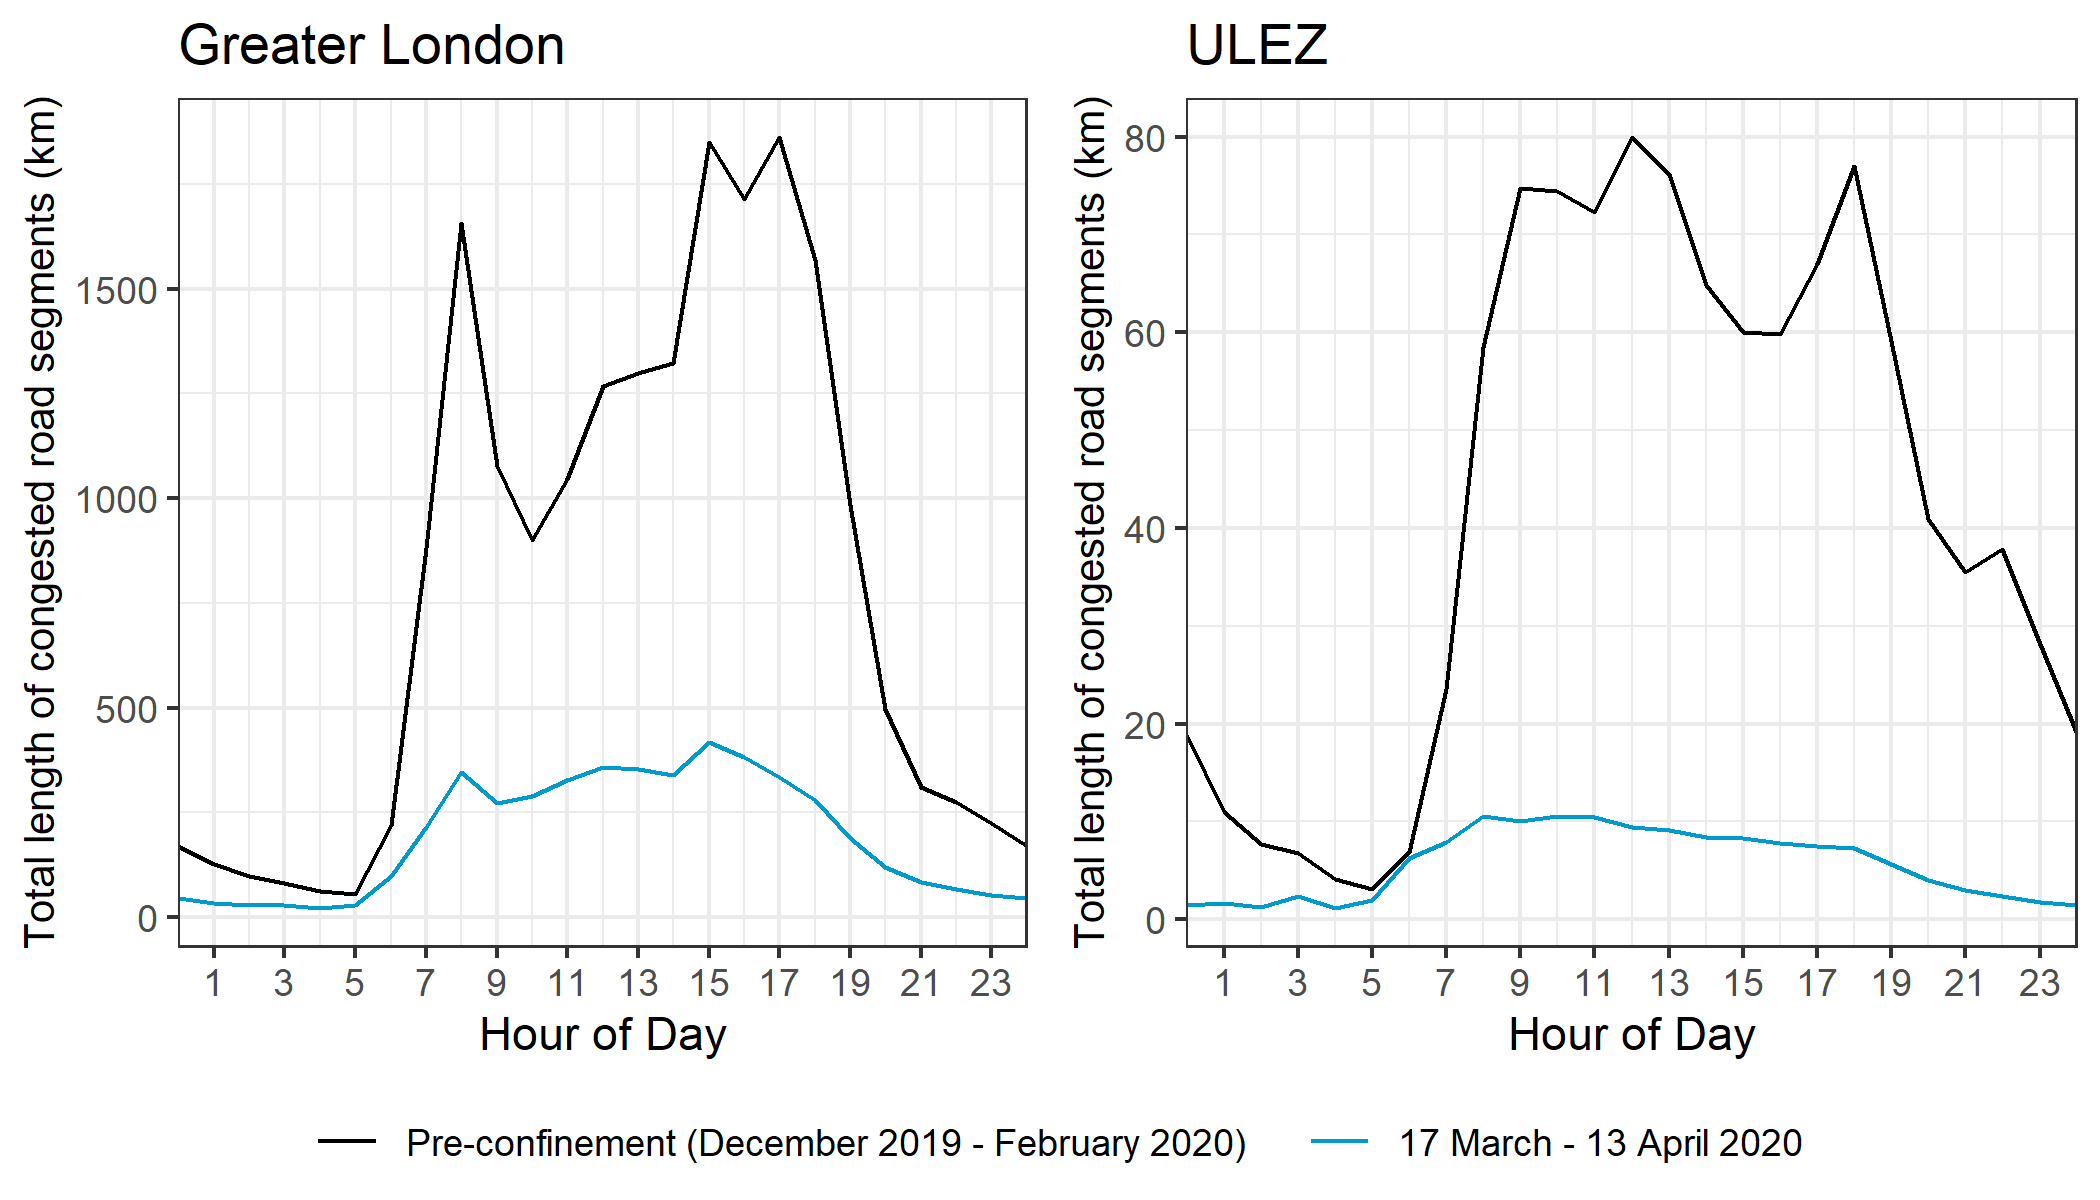
Waze data; mean total length of congested roads by hour during 17 March to 13 April 2020 compared to pre-confinement levels (scales are different).
Tie with traffic congestion
Road transport makes up nearly half of London’s NOx emissions, which is a combination of NO2 and nitrogen oxide (NO). Many people are now working from home and have stopped all nonessential travel, so we expected there was a tie between road traffic and the drop in NO2.
Based on data from the Waze For Cities Program, we found an apparent association between the reduced pollution levels and lower traffic congestion – or traffic jams – on London roads. Specifically, traffic congestion was reduced to such an extent that traffic was approaching free-flow in most Greater London roads after the stay-at-home order.
When we looked at the daily pattern of traffic congestion, we saw that the biggest drops in pollution and the biggest drops in congestion occur during the same time period – in the late afternoon from around 3 to 7 pm.
Yet this does not mean the roads are clear and free of emissions. There may have also been an uptick in large delivery vehicles bringing supplies into the city as well as goods and food to people’s homes, and at different times of day than normal due to lifted restrictions on delivery hours.
Air pollution, Covid-19 and health
Covid-19 is a respiratory illness. Due to the potential impact of air pollution on respiratory and other illnesses, measurement data from the UK’s air quality networks is important to the ongoing evaluation of risk to citizens during the pandemic.
Additionally, people with certain underlying medical conditions – including asthma, emphysema and heart disease – are at higher risk for severe illness from Covid-19. Long-term exposure to air pollution can cause many of these same harmful conditions and short-term exposure can make them flare up, so it’s critical to keep in mind the health impact of pollution – both long-term and as people are experiencing it now.
Importance of data
The new Breathe London analysis confirms that big changes in daily activities do make a difference in pollution levels, but of course life in lockdown conditions isn’t the future we want. And there’s still so much we don’t know – like the impact that lifting the ULEZ and other traffic restrictions has had on vehicles on the road, or how more people working from home has changed pollution from residential heating.
We will continue to review pollution data, looking at other air pollutants as well as different pollution sources, so we can learn from the current situation, arm people with information and help policymakers best protect people’s health.
*Pre-confinement levels are based on Breathe London network data December 2019, January 2020 and February 2020, with the exception of Christmas Day, Boxing Day, New Year’s Eve and New Year’s Day.