
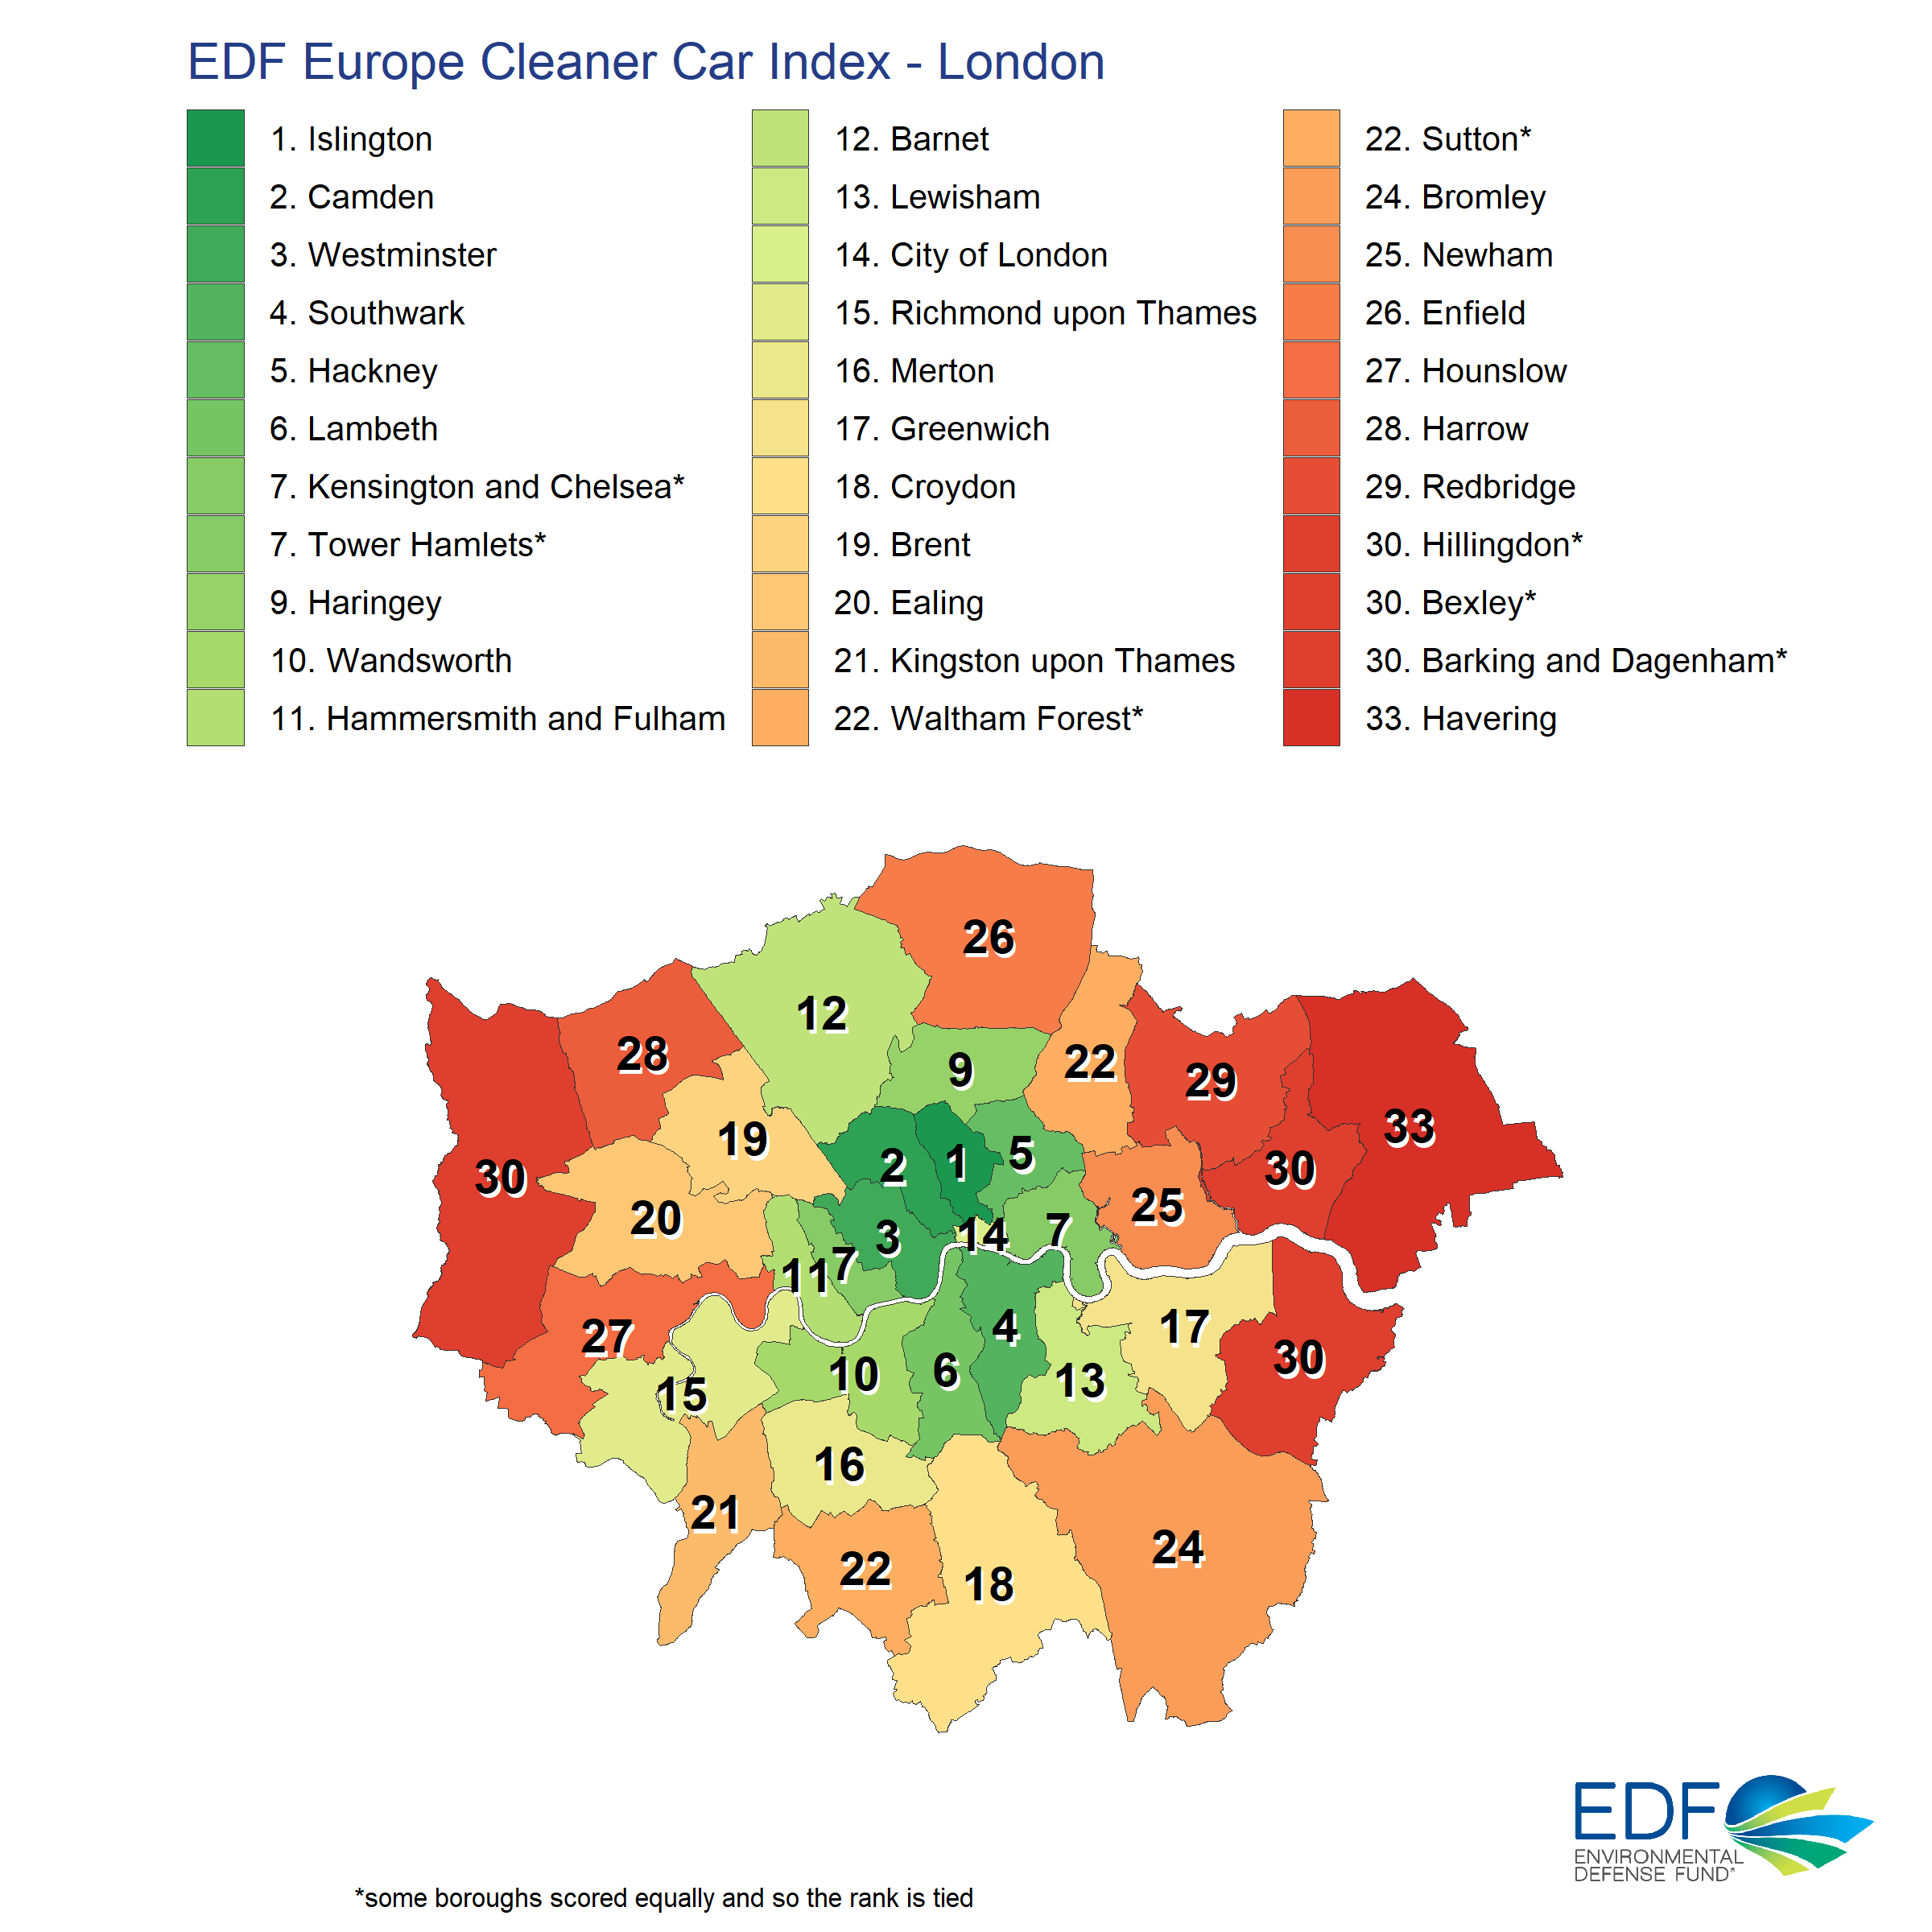
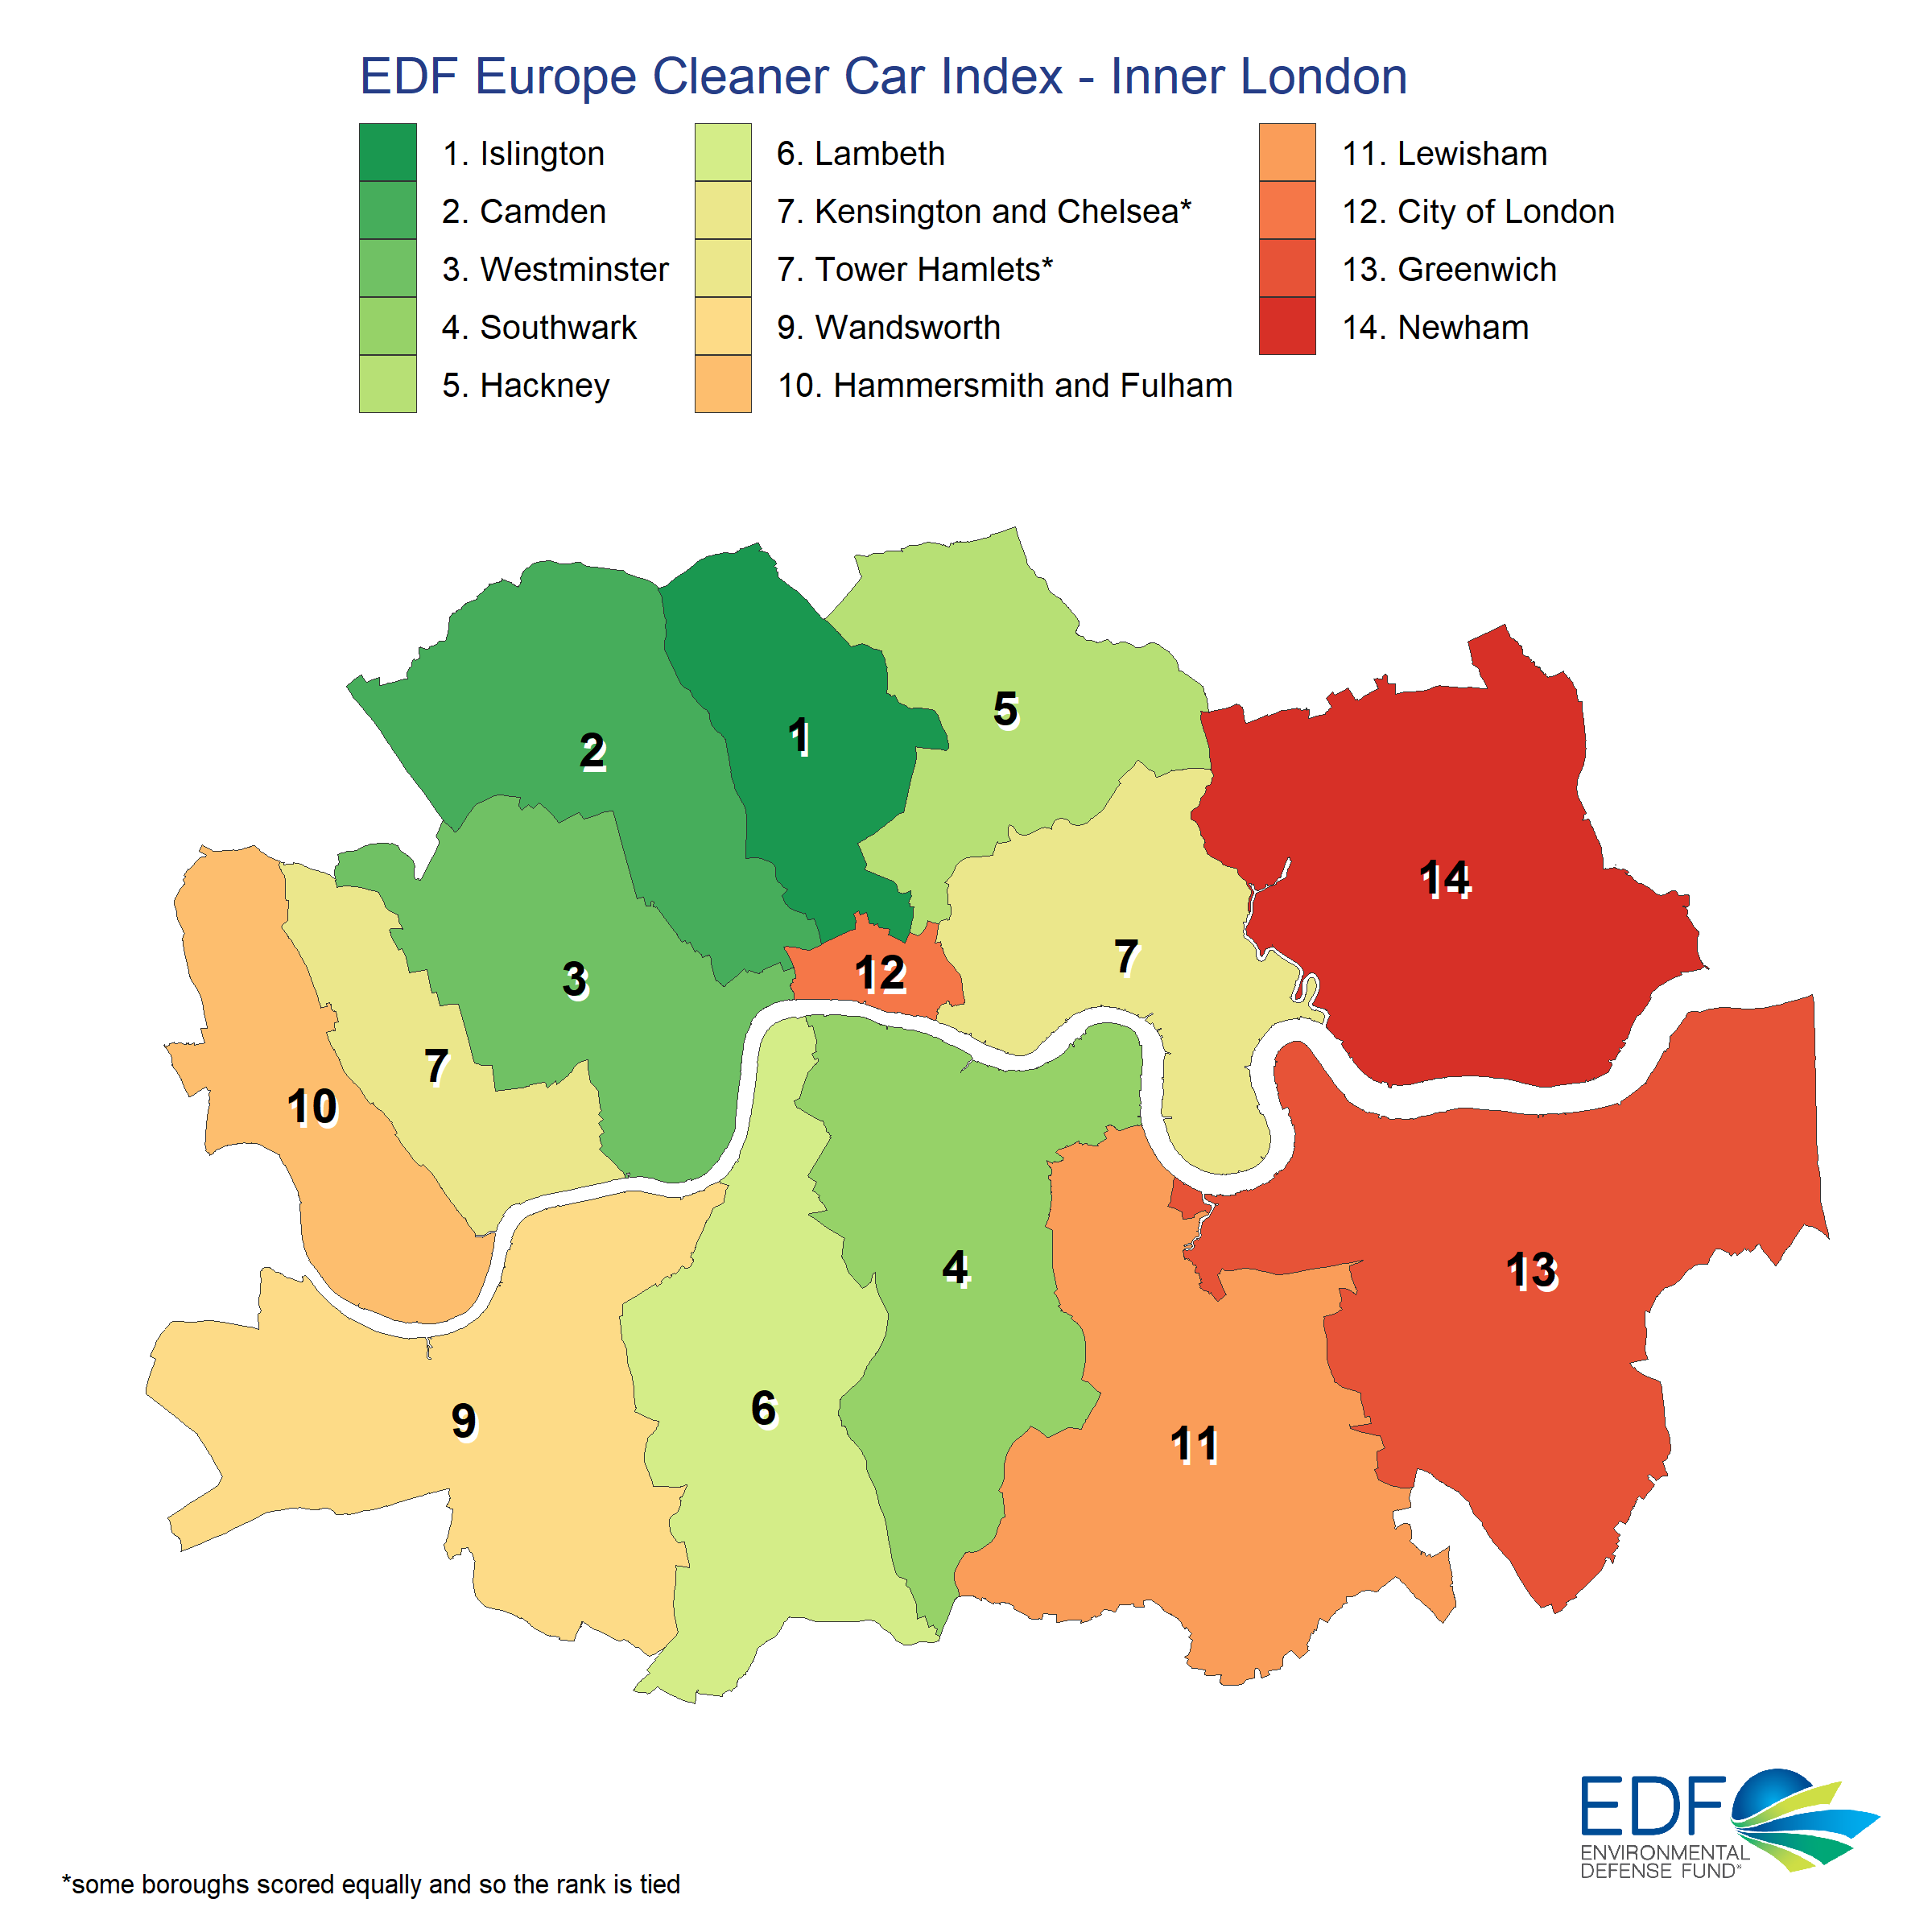
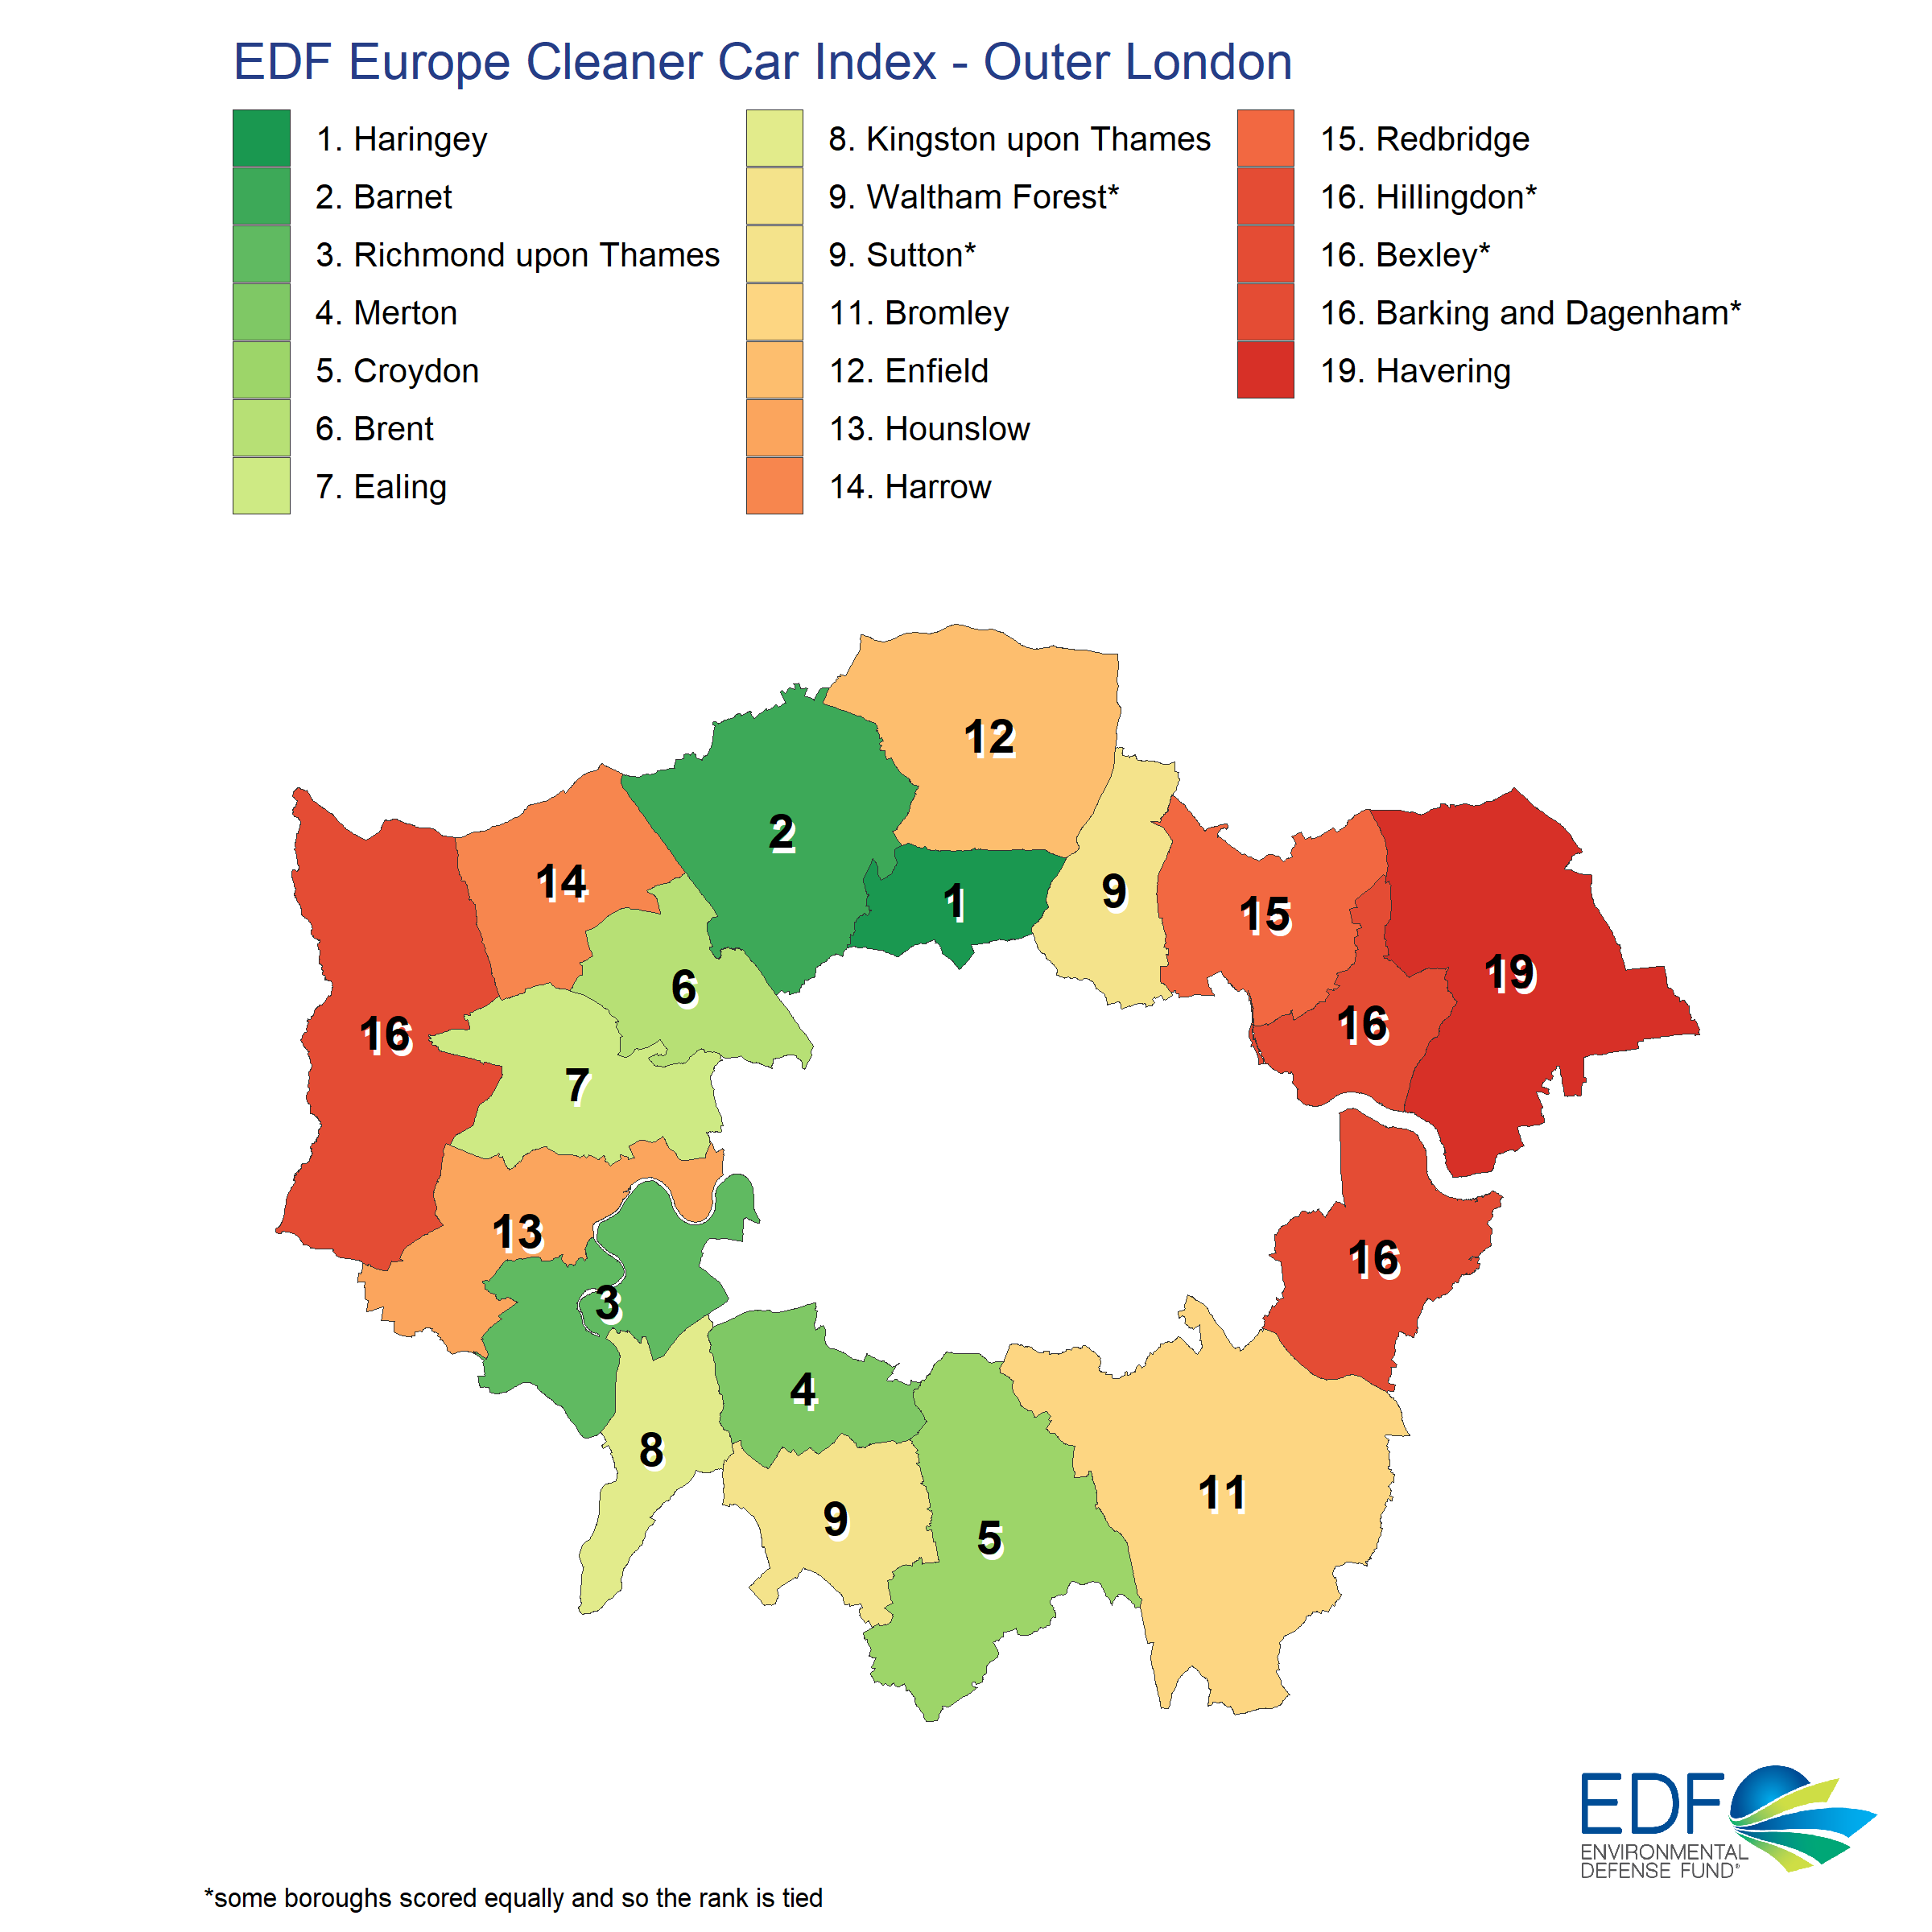
- New Cleaner Car Index developed by Environmental Defense Fund Europe shows Islington top ‘Cleaner car borough’ as Havering lags behind
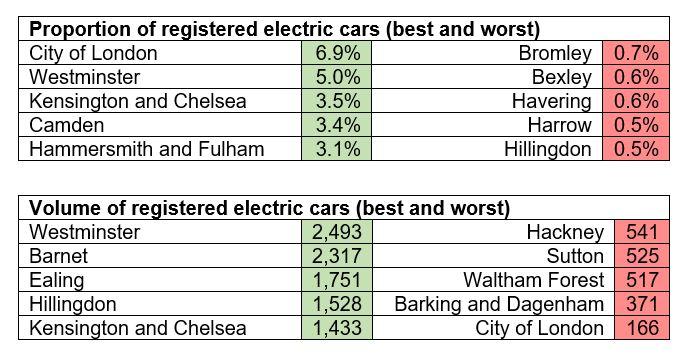
- Less wealthy priced out of going green: residents in Kensington and Chelsea three times more likely to own an electric car than in Barking and Dagenham.
- Number of cars continues to rise in Outer London boroughs (up 3,228 in a year) – diesel cars still on the increase in Hillingdon
- Electric revolution yet to arrive with 1.2% of 2.6 million cars in the capital electric; clear correlation between number of electric charge points and electric car ownership
- Call by campaigners to end residential parking permits for new diesel cars, increase electric charging points and levies to park at workplaces
New research by Environmental Defense Fund Europe (EDF Europe) reveals stark differences in the capital’s struggle to protect public health by using fewer cars and cleaner cars. It follows recent analysis that traffic congestion outside the city centre is now above 2019 levels.
Cars, particularly those fuelled by diesel, are a leading source of harmful air pollution and are linked to lower levels of physical activity amongst adults. Even modern ‘Euro 6’ diesel cars pollute levels of harmful NOx emissions that are 6 times higher than regulations. Air pollution shortens the lives of Londoners, leading to up to 9,400 extra deaths per year.
The ‘EDF Europe Cleaner Car Index London’ reveals the boroughs that are encouraging Londoners to make cleaner car choices and those at risk of a car-led recovery as the capital emerges from lockdown. The research identifies where local policies to phase out diesel cars, such as electric charge points, phasing out new parking permits for diesel cars, as well as levies on employers with high levels of workplace parking could help bring about change.
Oliver Lord, Head of Policy and Campaigns at Environmental Defense Fund Europe, said: “We have to ensure that the chance to go green is accessible to everyone, with targeted action. Our analysis shows that with the right nudges and funding, councils can support residents to cut car trips, ditch diesel and save lives.”
The index is based on a new breakdown of Department for Transport car registration data for 2019 using an average ranking of three indicators: car ownership per household, the proportion of diesel cars and proportion of electric cars registered in each London borough.
Cllr Rowena Champion, Islington Council's Executive Member for Environment and Transport, said: “Islington Council is determined to create a cleaner, greener future for local people. Being top of the Environmental Defense Fund Europe’s Cleaner Car Index reflects some of the positive steps we have taken towards achieving this, but we know there is still more work to be done.
“Reducing vehicular emissions is essential to tackling the climate emergency and cleaning the air that local people breathe, which is why the council has so far implemented a total of 29 School Streets, introduced more electric vehicle charging stations, and joined a London-wide campaign encouraging businesses to tackle the pollution caused by idling engines.
"We know that the majority of Islington's residents do not own a car, which is part of the reason why we are continuing to create people-friendly streets, which make walking and cycling easier, safer and more accessible for all. By making travel easier for those without a car, and by reducing any unnecessary journeys from those that do, we can create a greener Islington."
Indicator 1: Car ownership
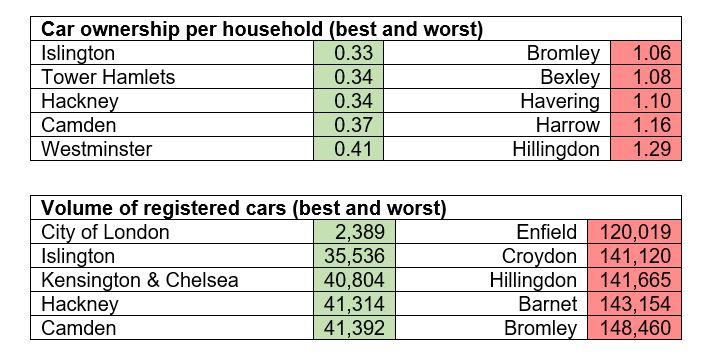
Car ownership is associated with less physical activity, such as children walking to school less and has an annual cost to the NHS of £650 million per annum in London. Last year, more than 2.6 million cars were registered in the capital, with levels per household varying significantly across the capital.
The past decade has seen a steady decrease in car registrations in Inner London. These boroughs tend to have lower car ownership rates than Outer London, which is partly owing to better public transport connectivity but also progressive sustainable transport policies. Low car ownership in Inner London is also linked to more physical activity amongst adults.
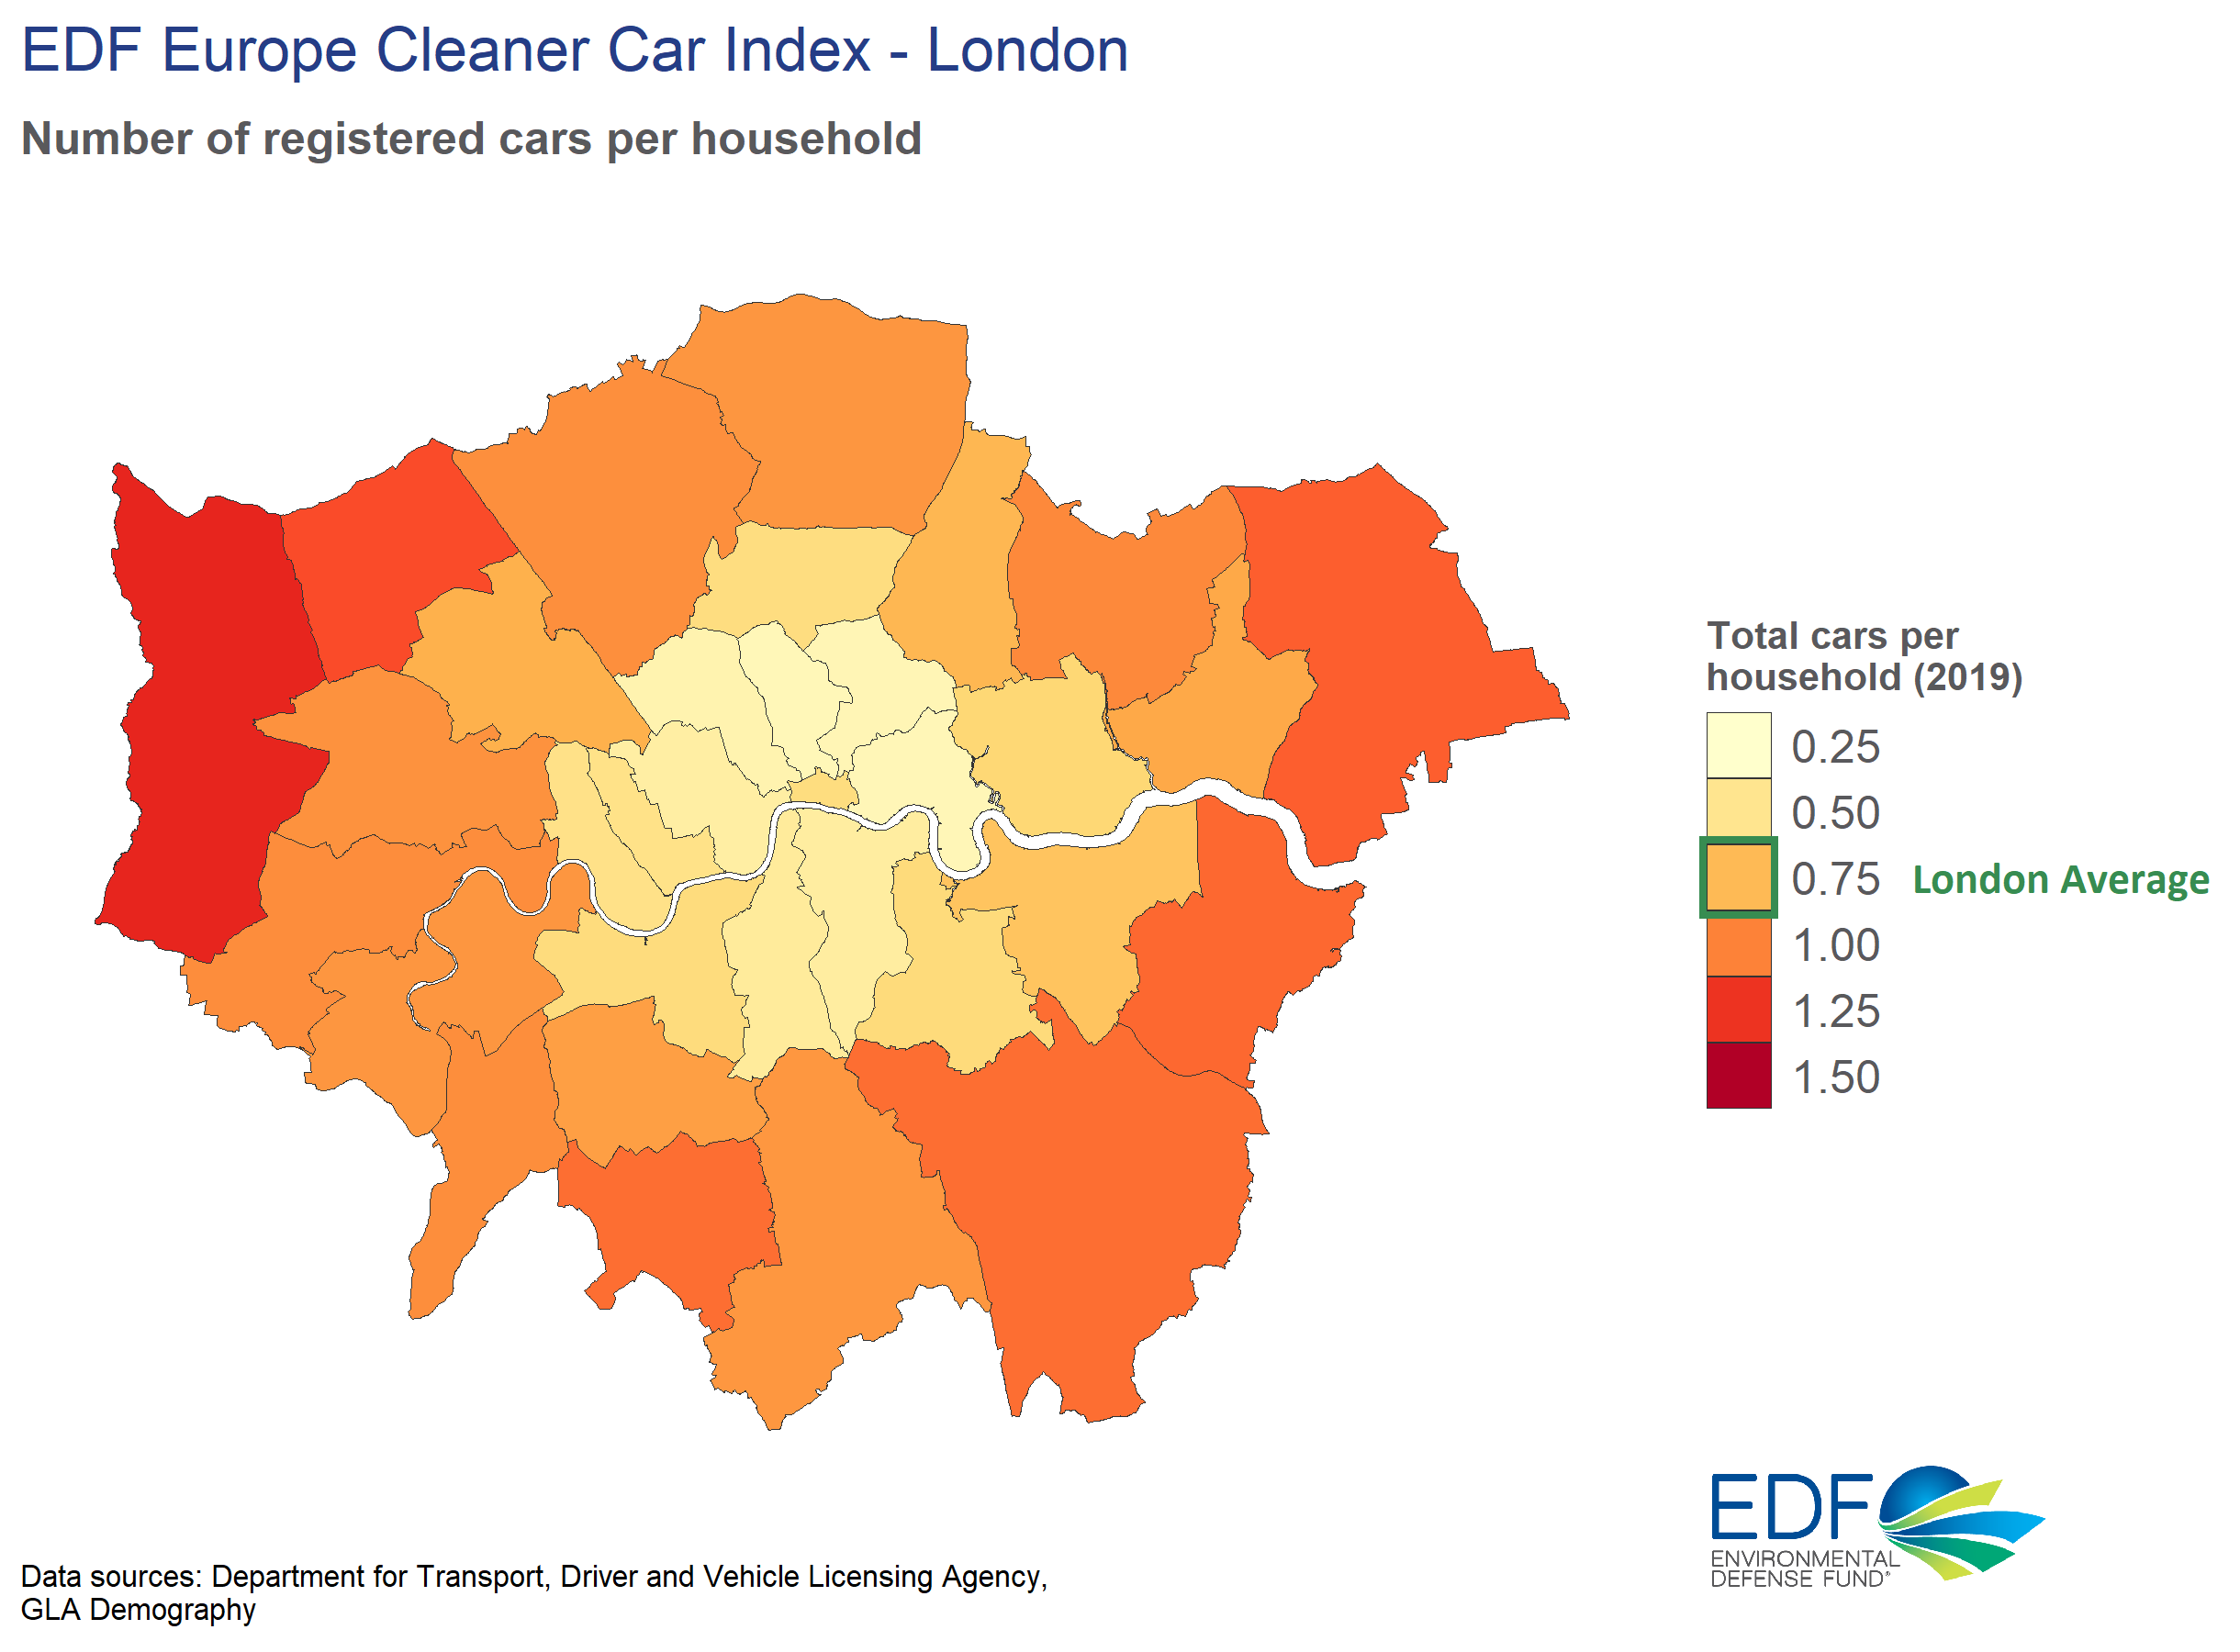
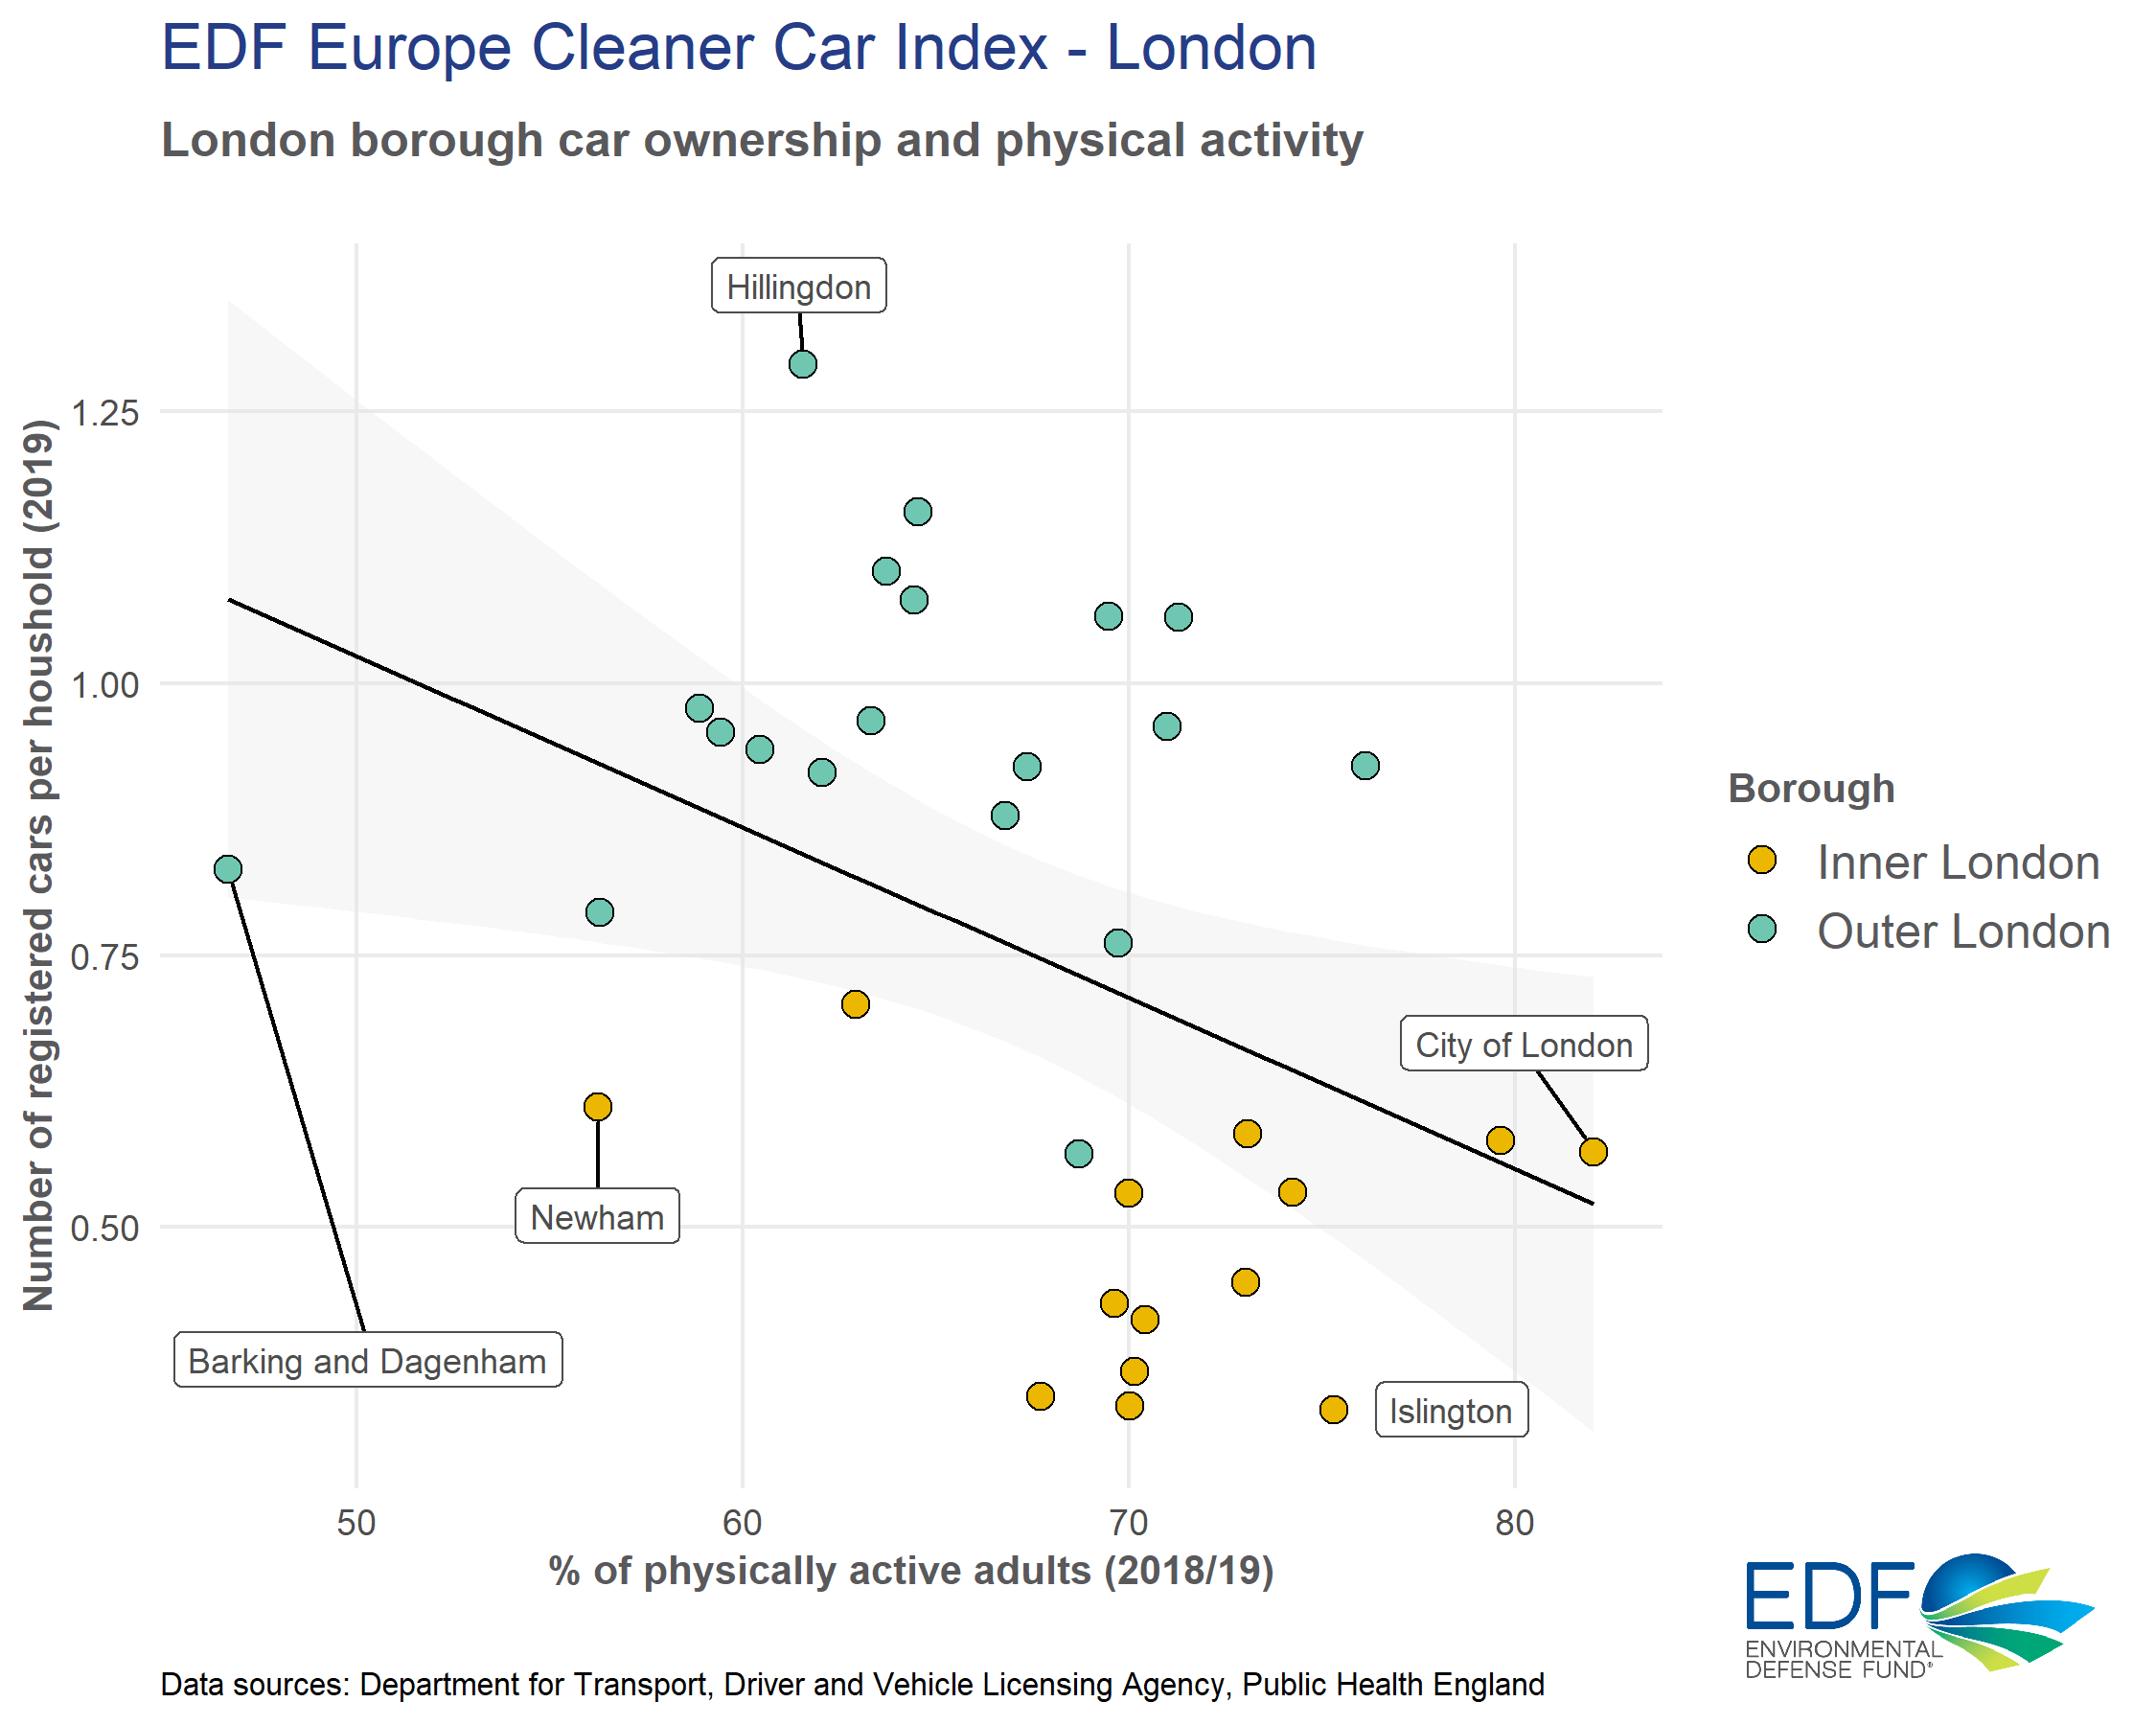
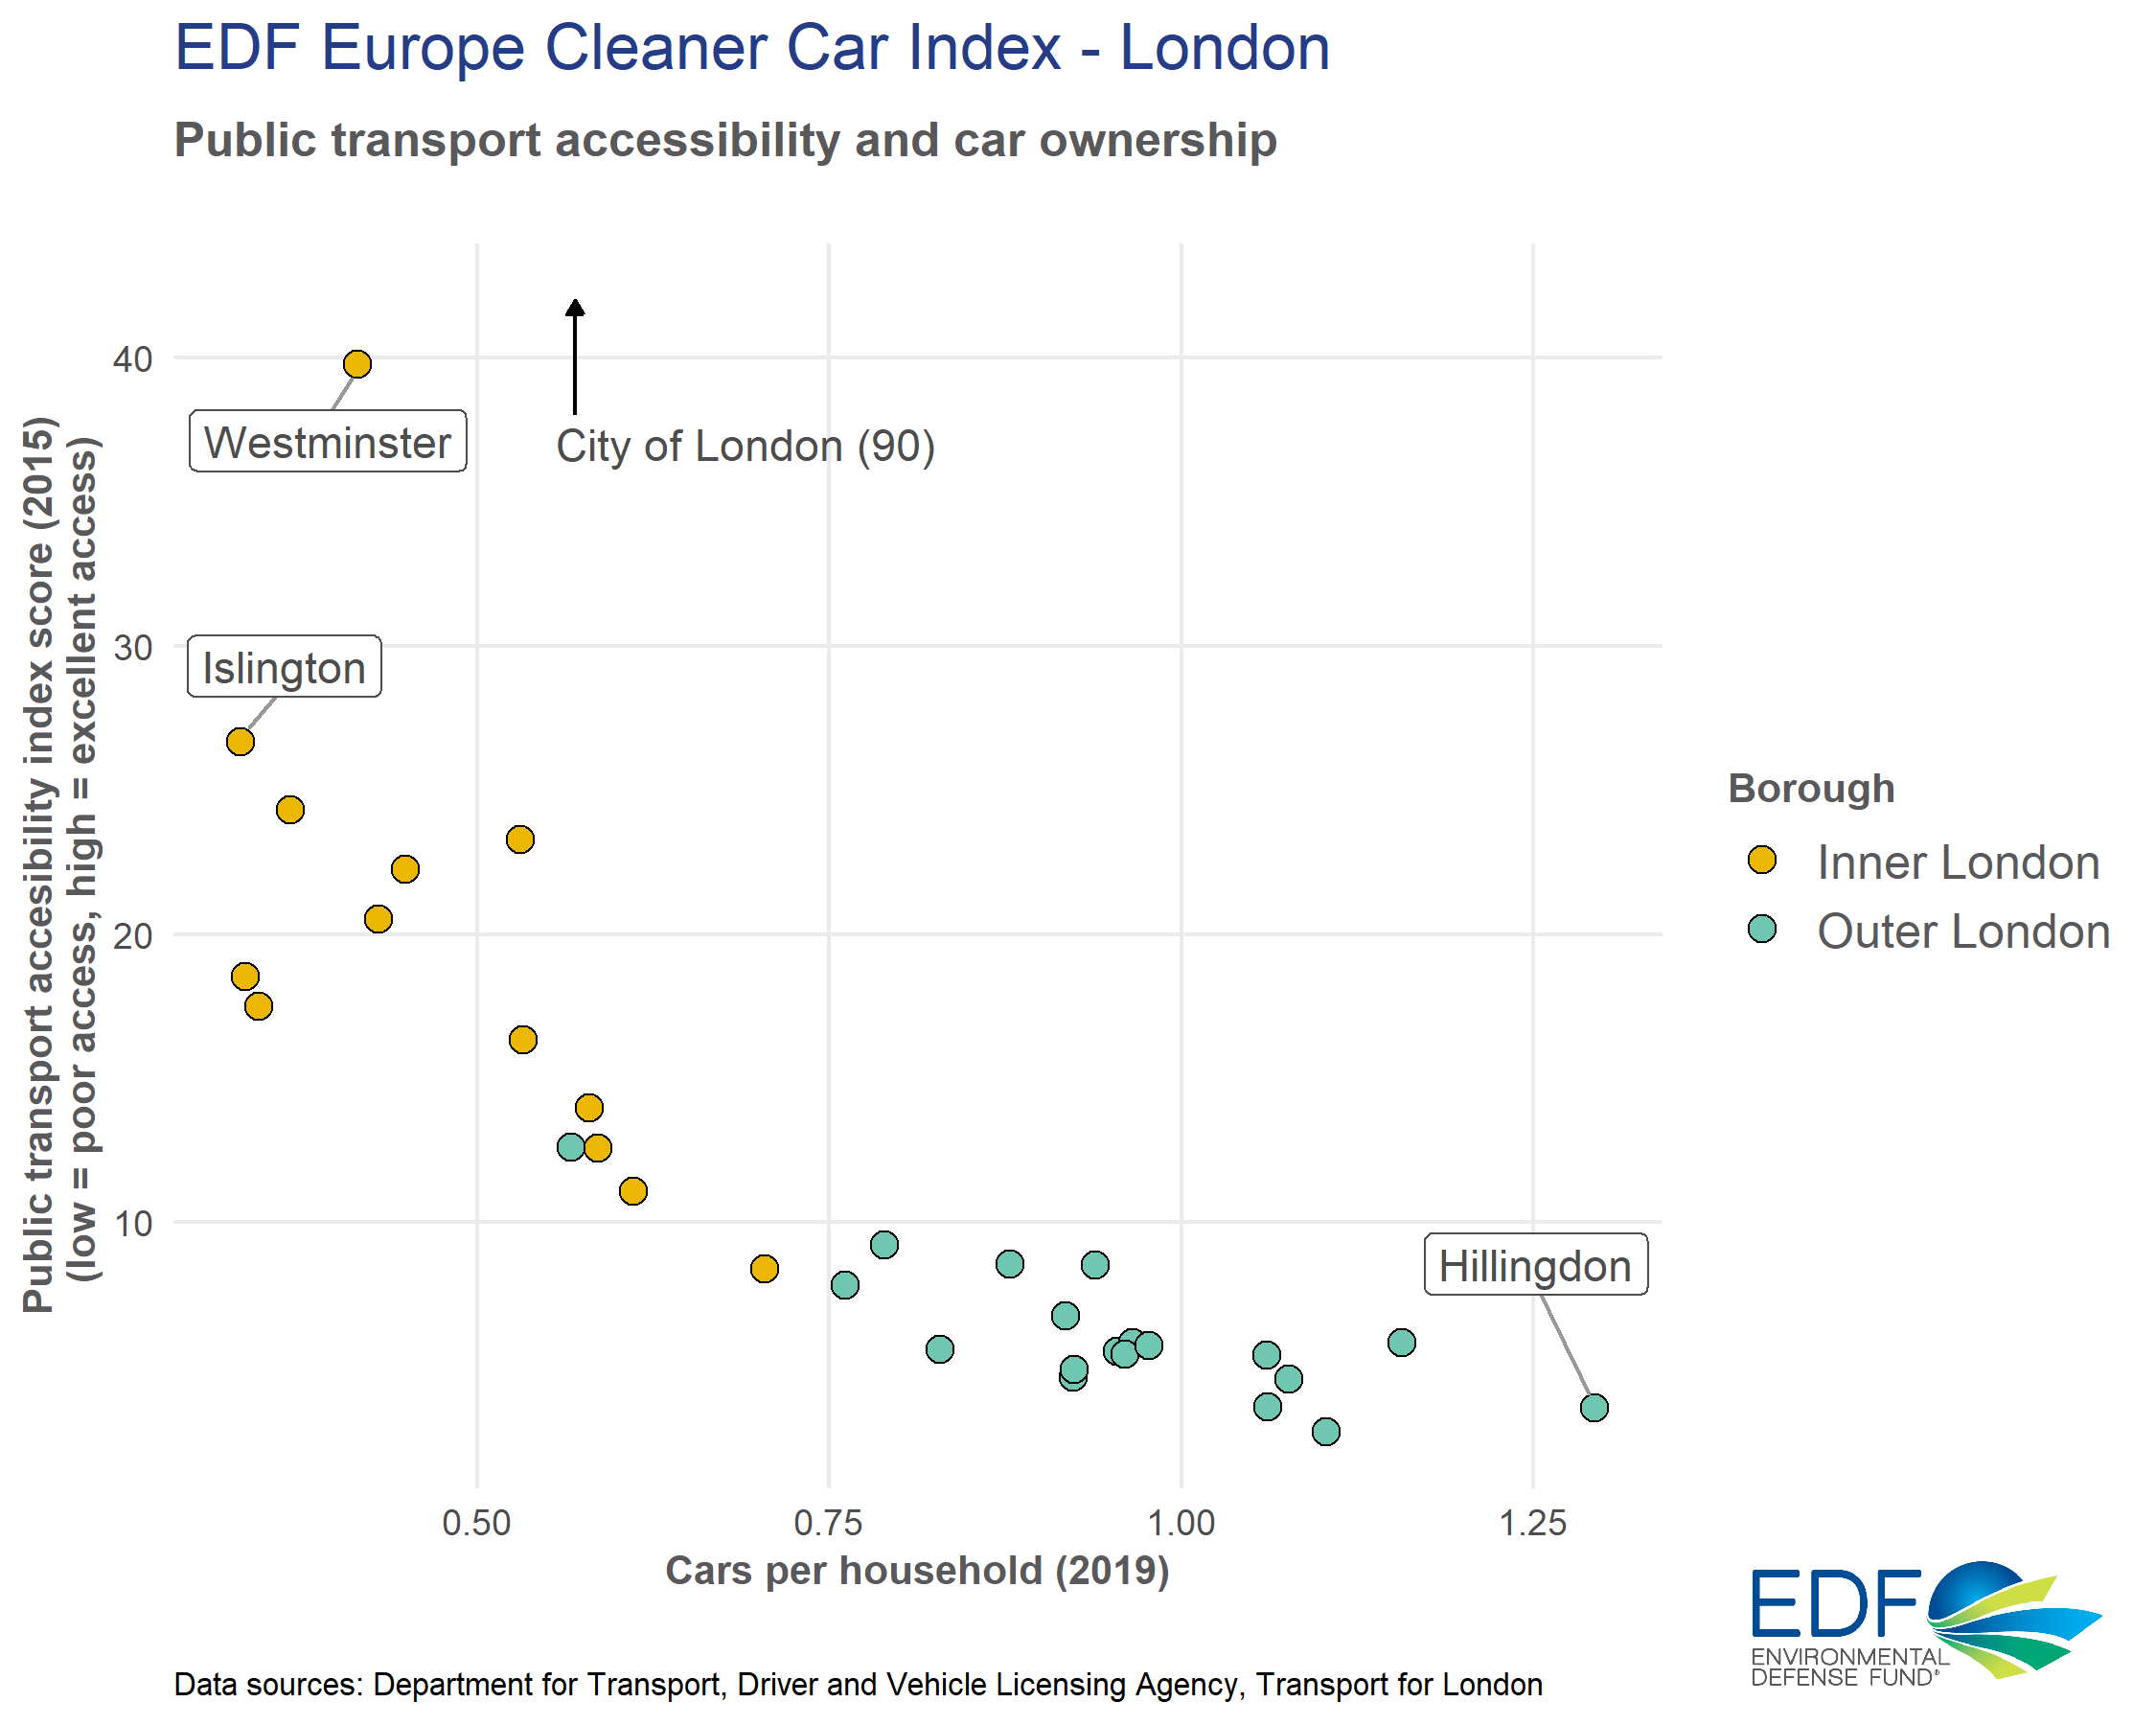
Outer London boroughs continue to have high levels of ownership with increases in car registrations last year (up 3,228 from 2018-2019) despite there being three million trips by private motor vehicles within Outer London that could be feasibly walked, cycled or switched to public transport on an annual average day. However, there is a clear difference in the level of public transport connectivity. On average, Inner London boroughs have a public transport accessibility index score more than three times higher than Outer London boroughs.
As more people travel to work, there is a risk of a car-led recovery in Outer London given most commuting trips were made by car before lockdown (56%) and levels of car ownership are much higher. An effective way to inspire commuters to take cleaner transport and to raise funds for better public transport connectivity would be for Outer London boroughs to introduce workplace parking levies on large employers. This has been done in Nottingham, where a levy on businesses with large numbers of car parking generates £10 million a year for public transport services and has increased levels of cycling.
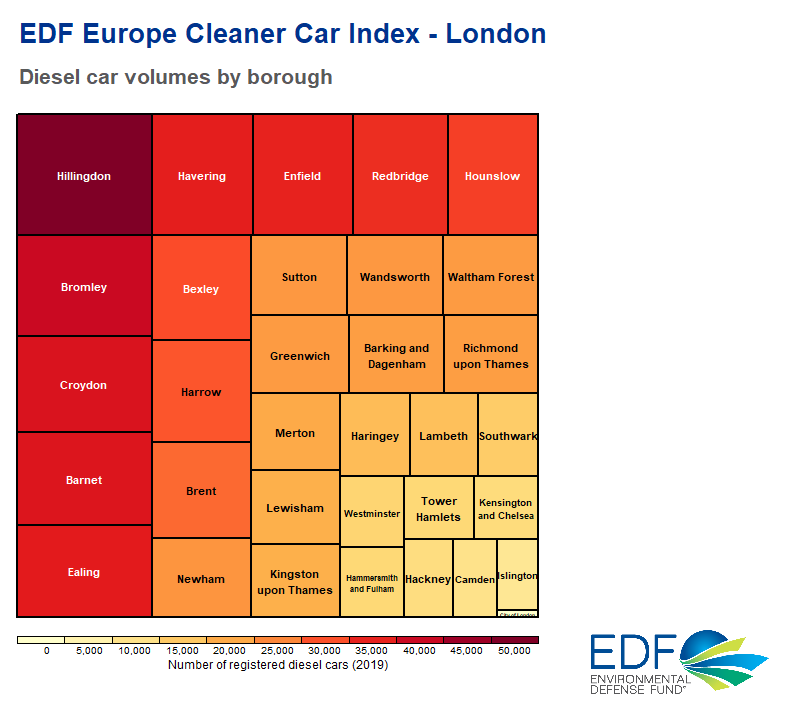
Indicator 2: Diesel cars
There has been a notable effort in the capital to discourage the use of diesel cars given they are responsible for dangerous pollution levels.
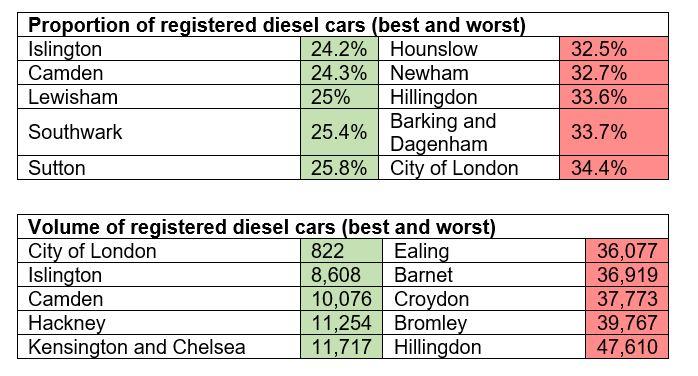
Encouraging is that data shows a yearly average decline in diesel car registrations across London since 2018, which is when the Mayor of London confirmed the upcoming expansion to the Ultra Low Emission Zone. Boroughs with the greatest reduction in the proportion of diesel cars – Camden, Islington and Westminster – have all taken effective action to discourage their use, such as diesel surcharges on parking.
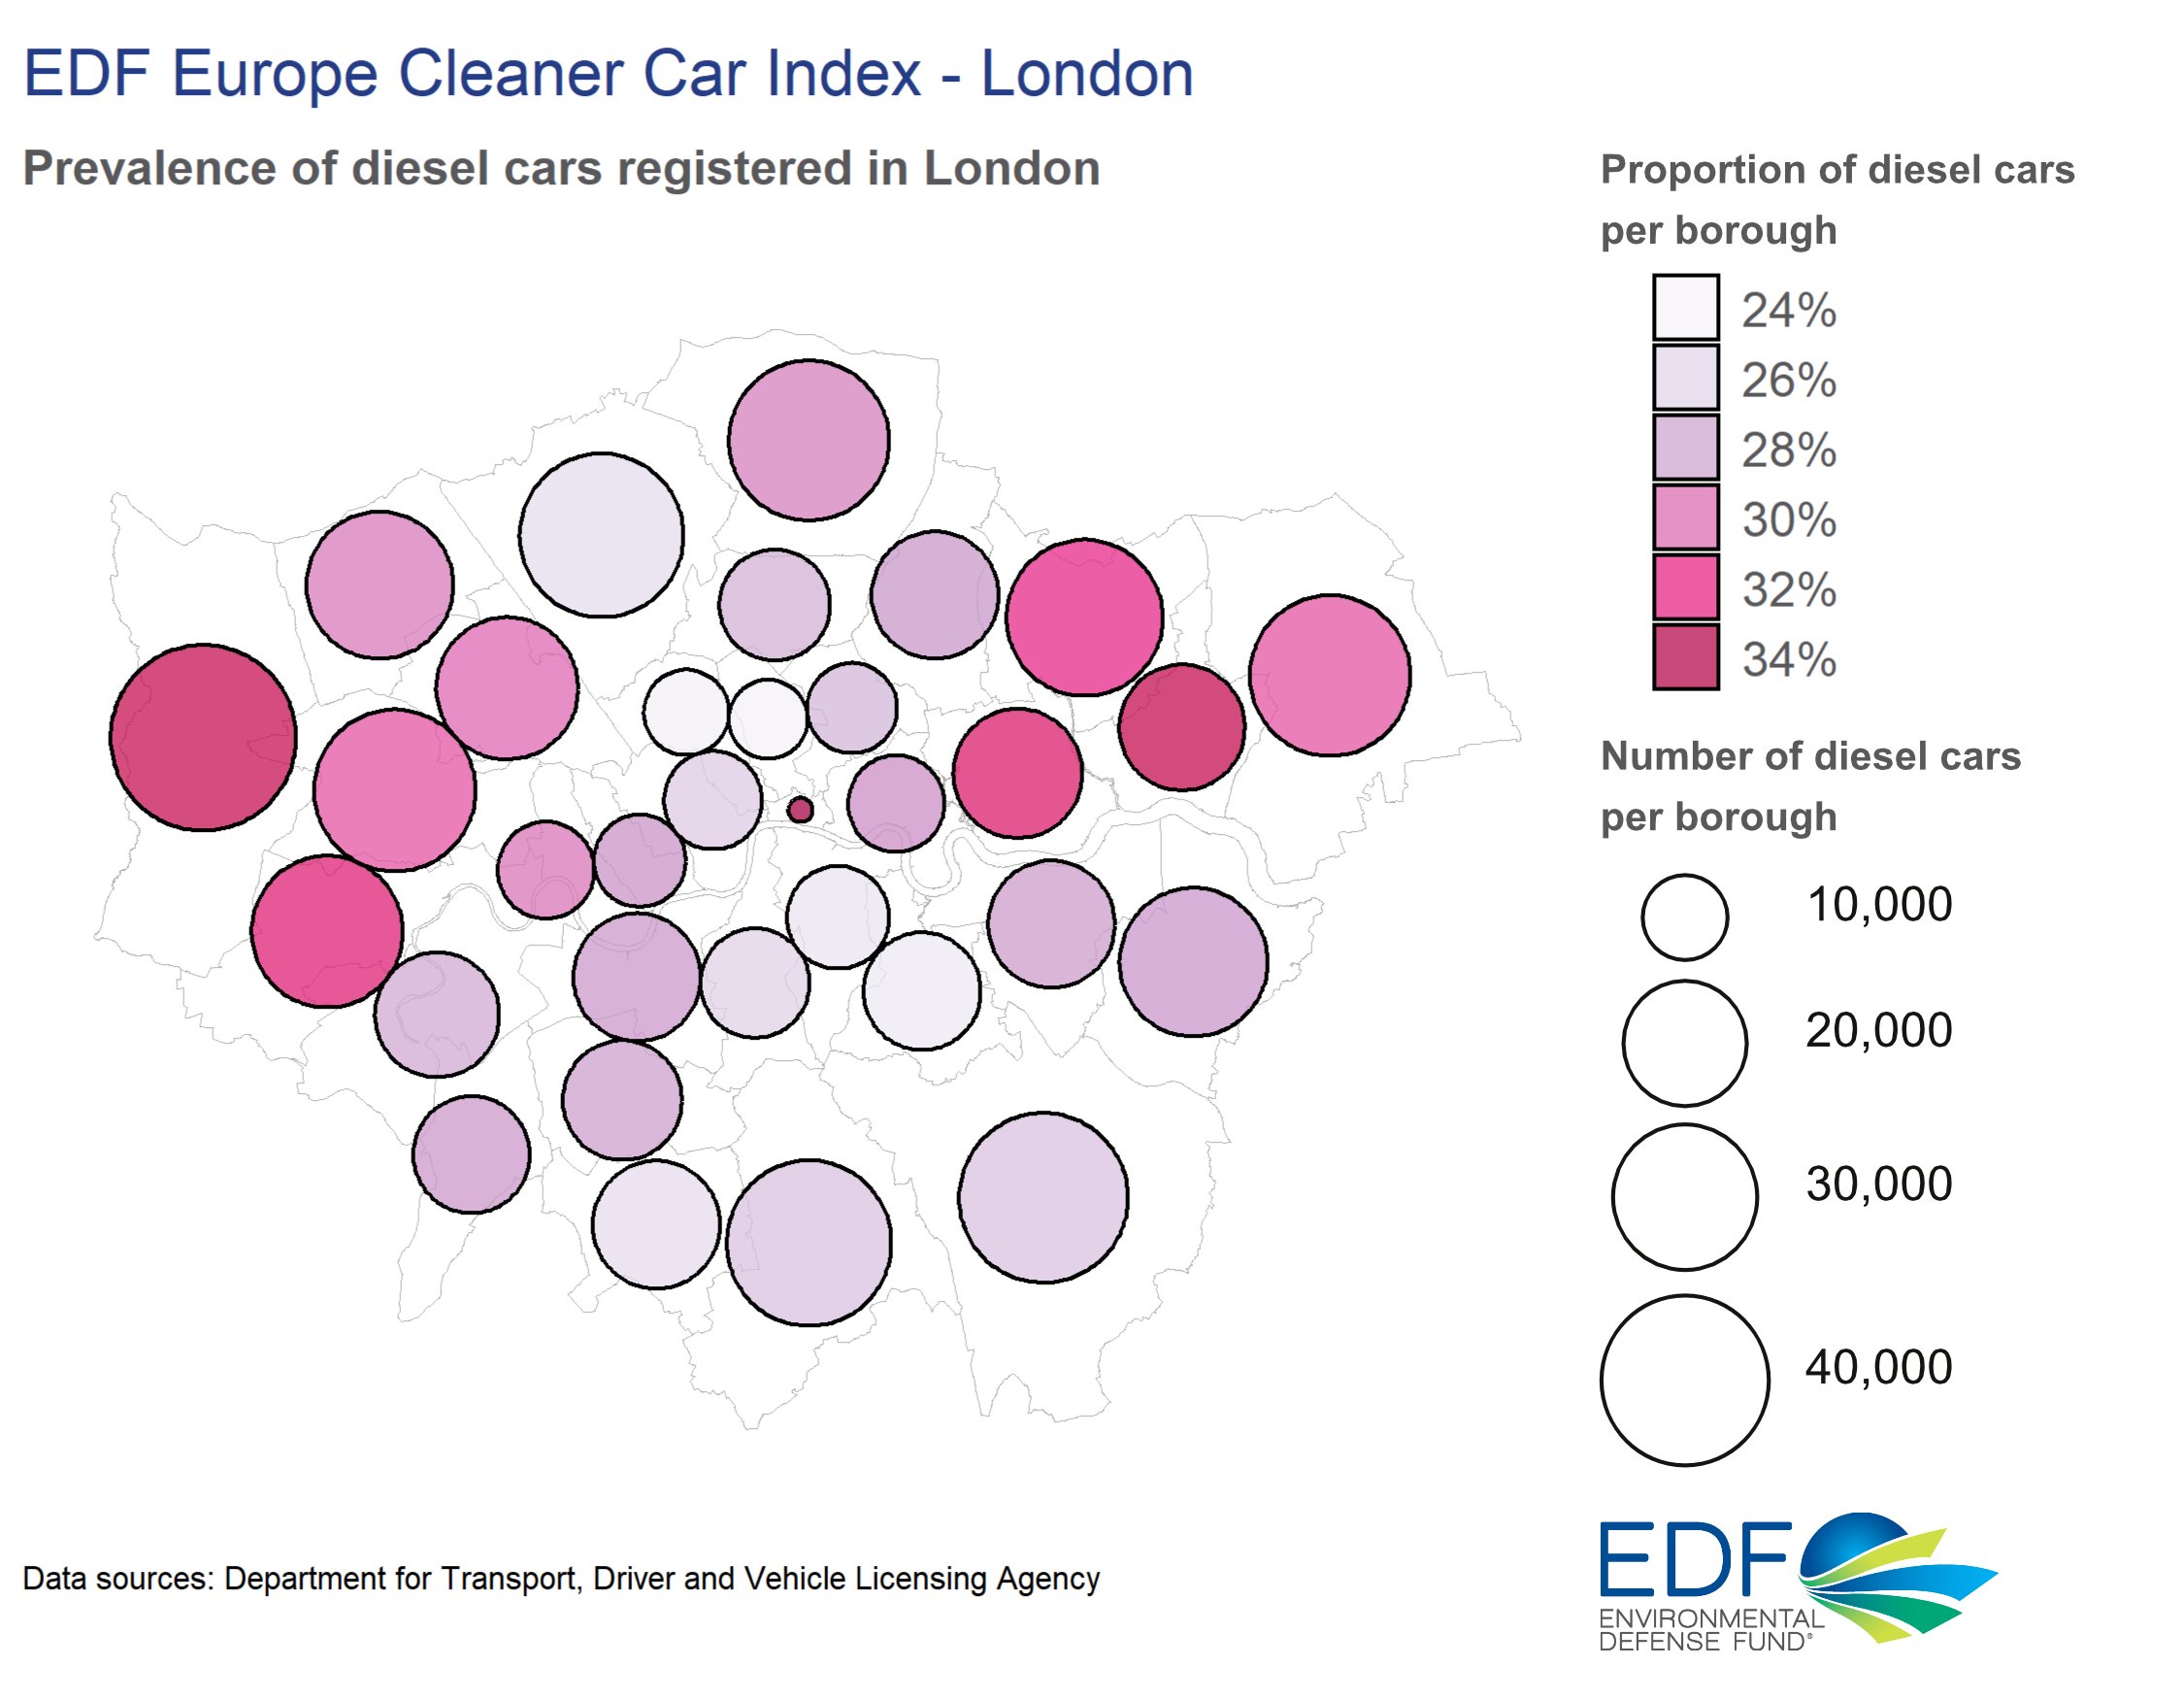
Whilst the proportion of diesel cars is decreasing, there are still more than 750,000 diesel cars registered in London and a quarter can be found in just five boroughs: Hillingdon, Bromley, Croydon, Barnet and Ealing. Of notable concern is Hillingdon, which has seen a year-on-year increase and has the highest volume of any borough. Nearly half of all households in Hillingdon (43%) have a diesel car: with 47,610 diesel cars for 109,507 homes.
Data sources: Department for Transport, Driver and Vehicle Licensing Agency
Targeted action in these boroughs would help to improve air pollution across the capital. This could include setting a date when no new residential parking permits will be issued for diesel cars, such as 2025. A similar policy has been applied for London-wide taxi licensing, which is proving to be effective at phasing out diesel taxis. Other policies, such as surcharges for on-street parking in local high streets would help to discourage the use of diesel cars where pollution is often worse.
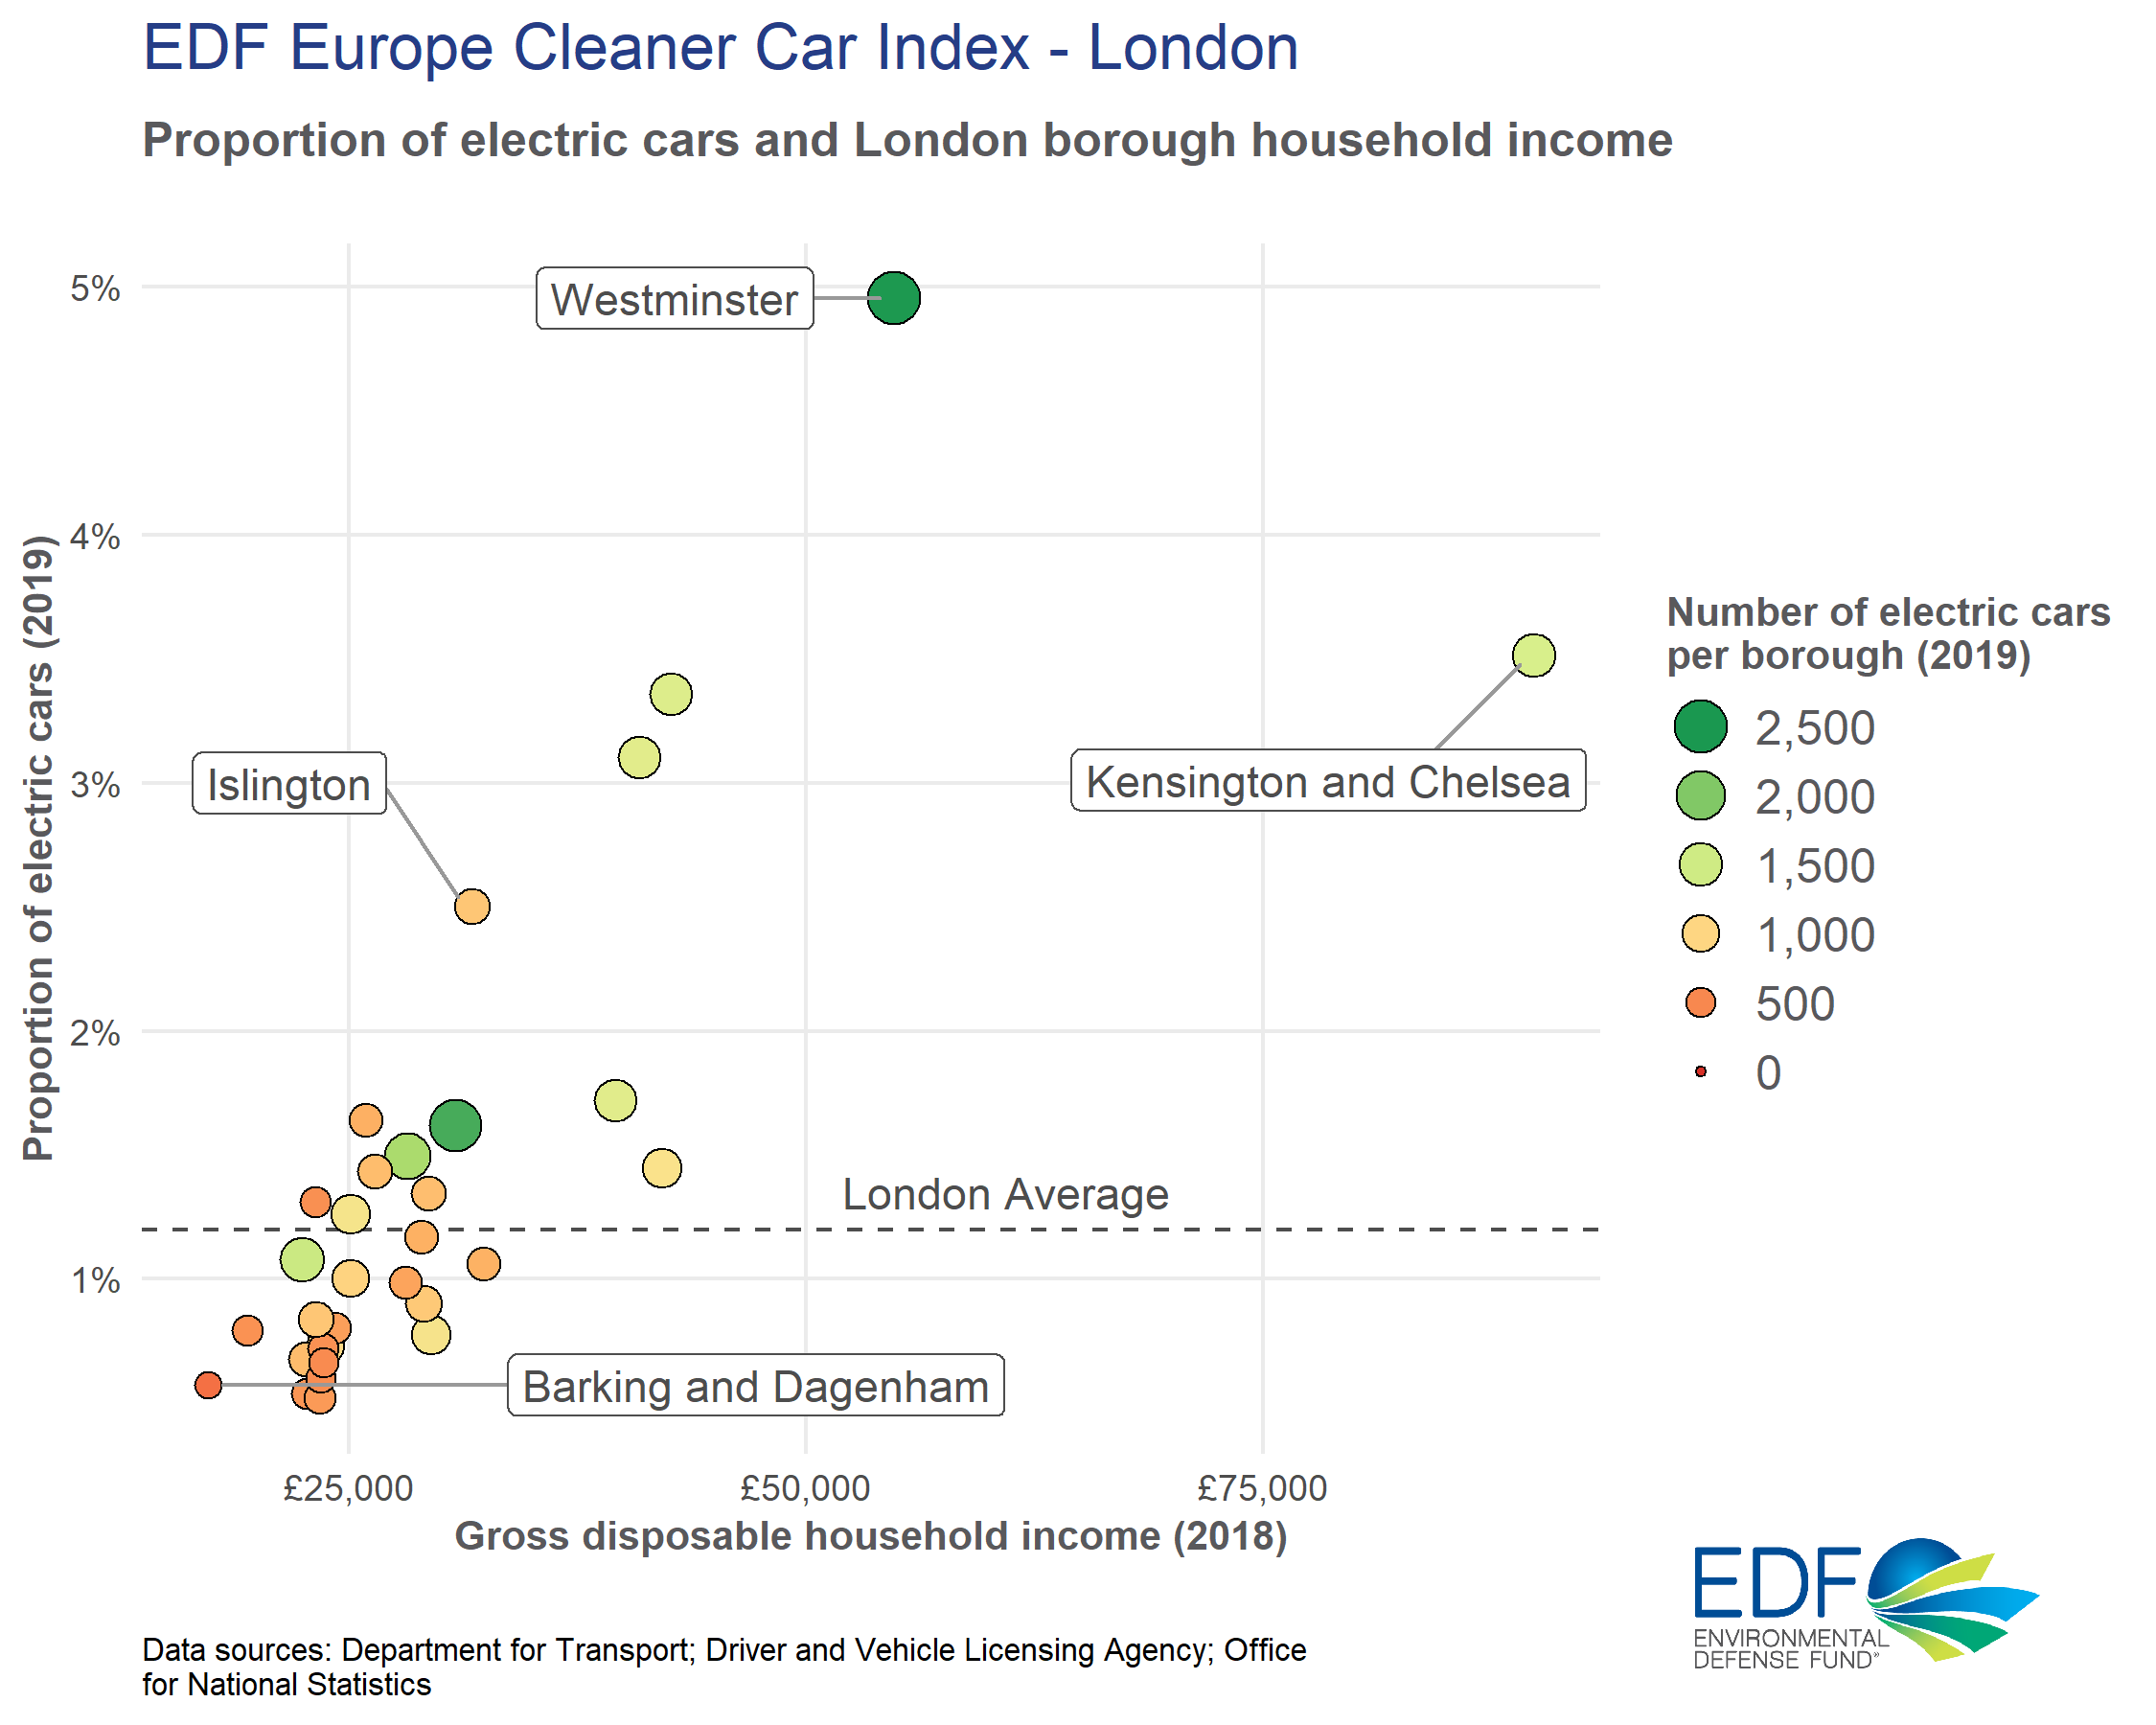
Indicator 3: Electric cars
Where walking, cycling or public transport is not possible, increasing the proportion of electric cars is critical to helping Londoners breathe clean air and essential to decarbonising the capital’s transport network.
The Mayor of London has a target for all new cars registered in the capital to be zero emission from 2030. However, whilst there has been a marked increase in electric cars in the past few years, they still only account for 1 in every 100 cars in the capital (1.2%).
Financial support, such as the Mayor of London’s car scrappage scheme, will be critical to help Londoners make the switch given electric cars have a premium price. The proportion of electric cars in a borough is related to the gross disposable income of its residents. For example, residents in the Royal Borough of Kensington and Chelsea are three times more likely to own an electric car than in Barking and Dagenham.
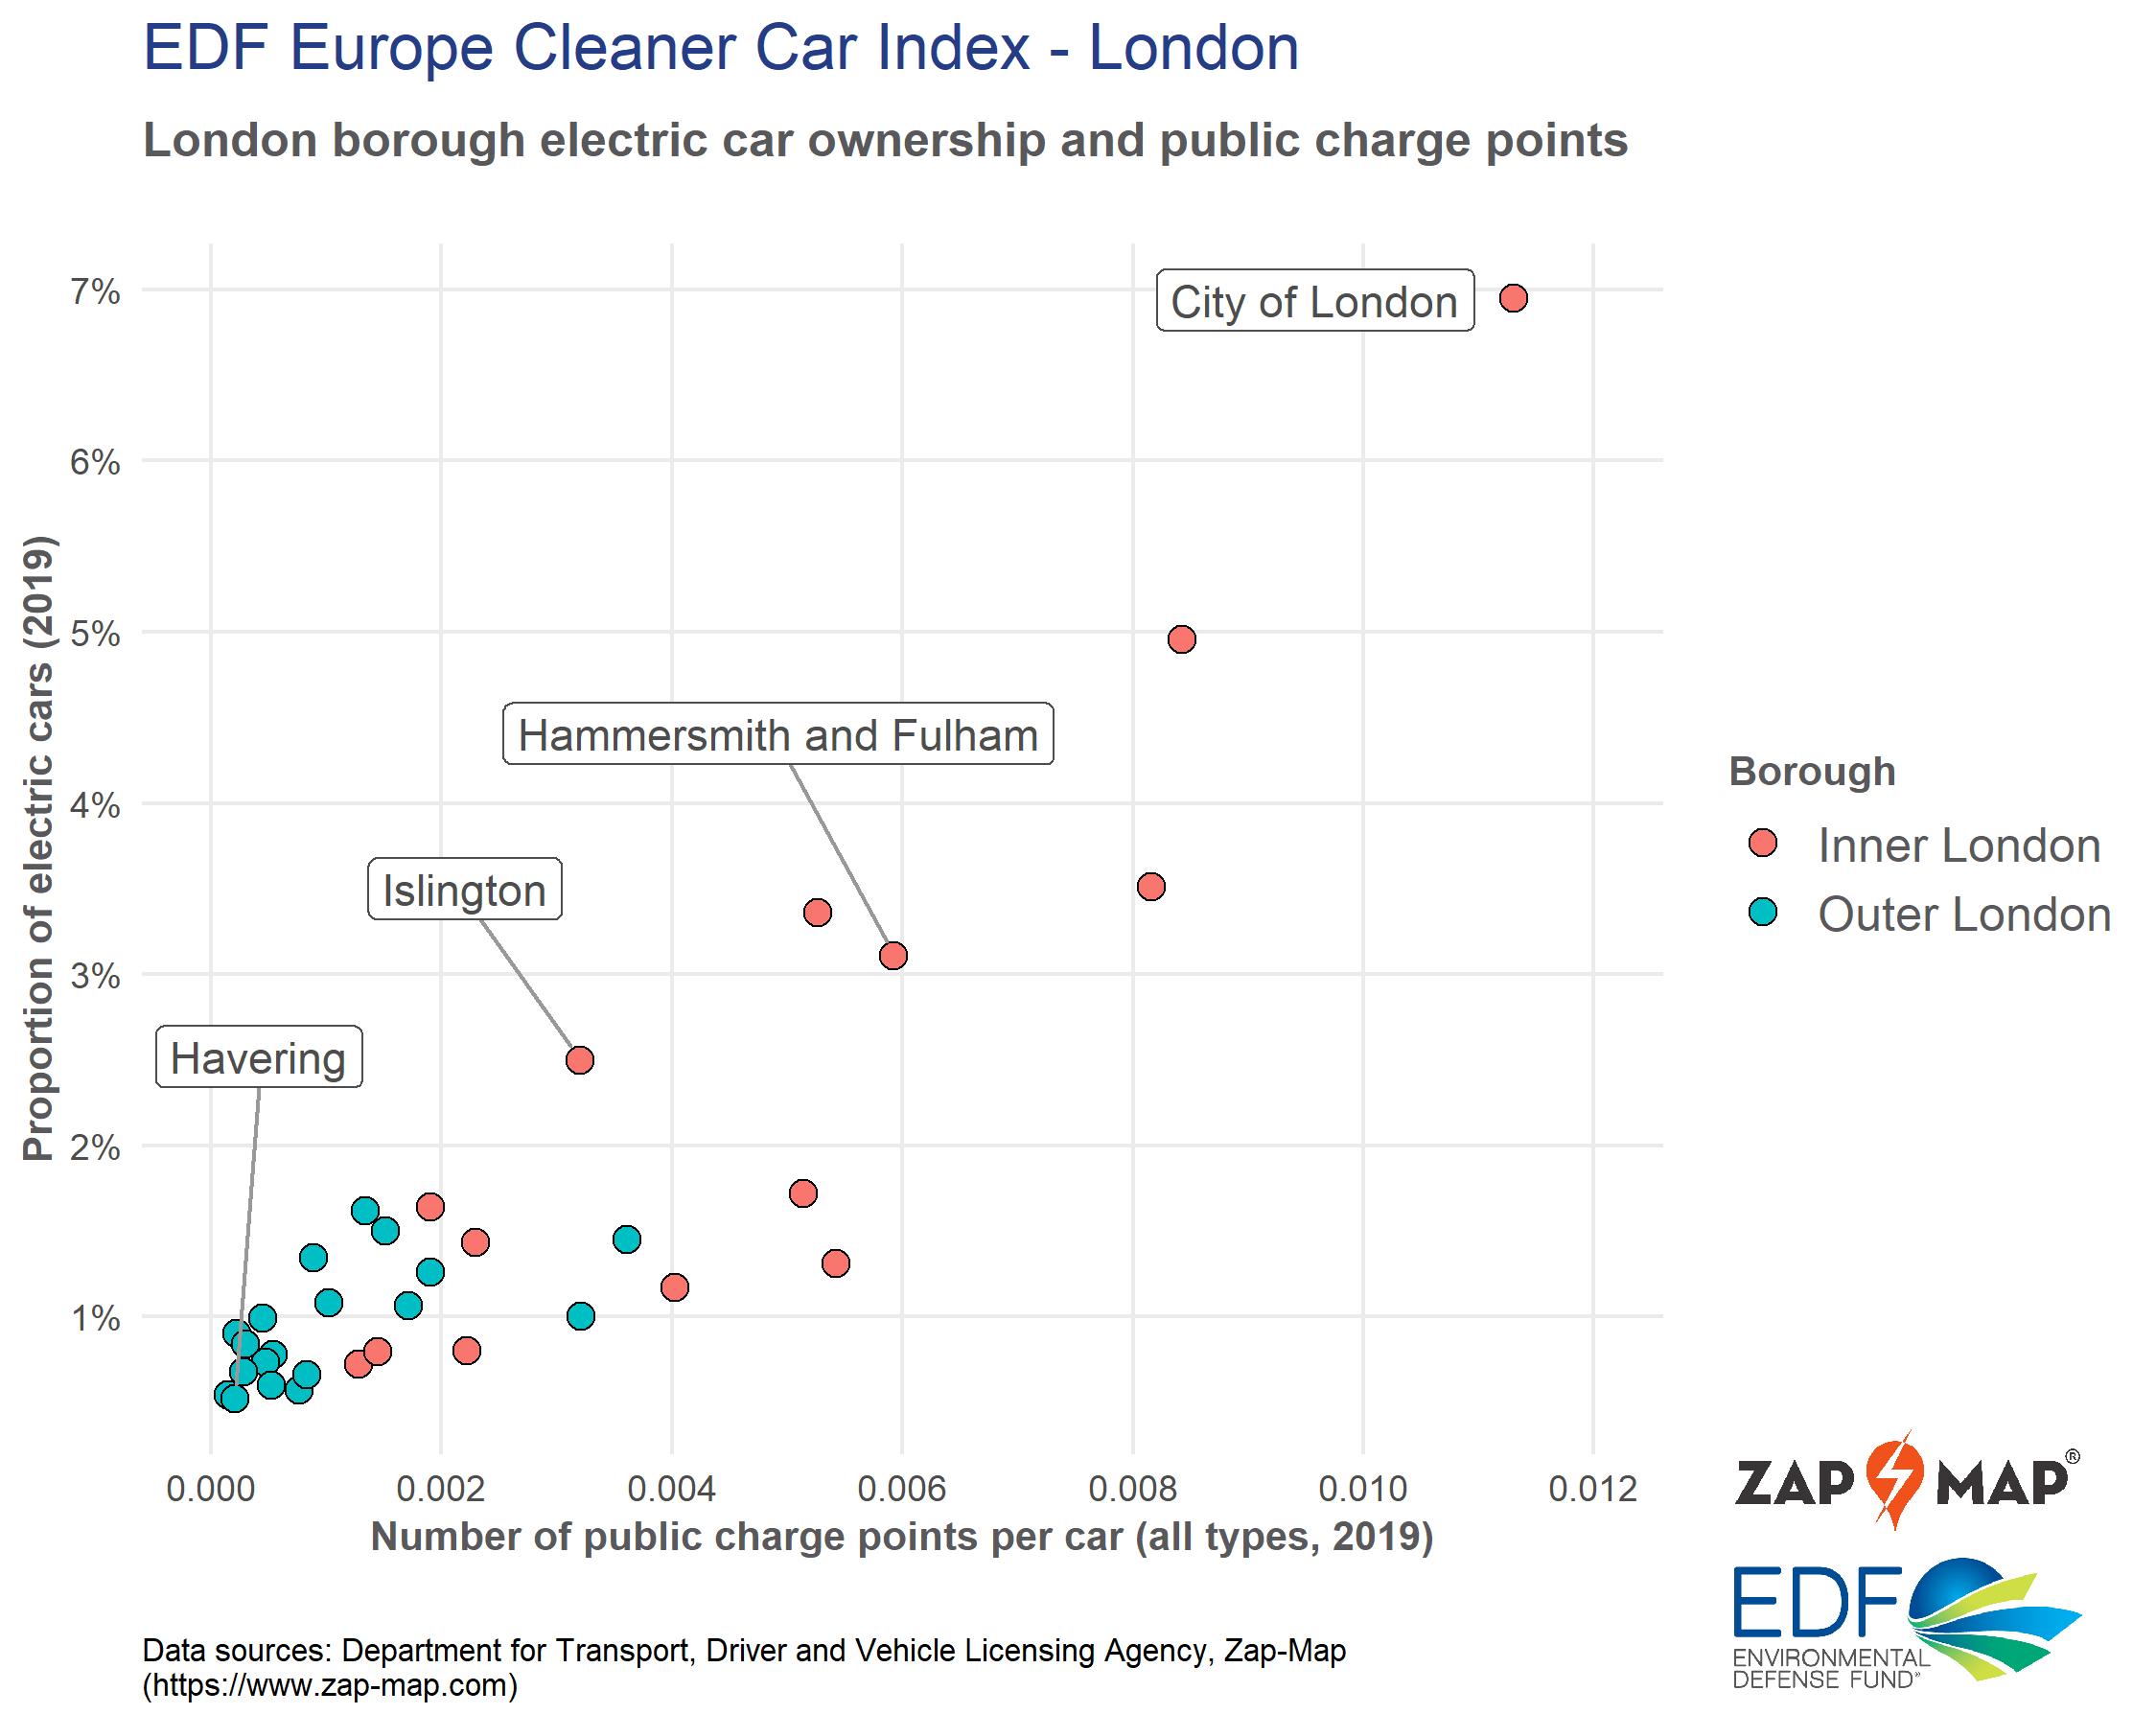
Boroughs successful at increasing the proportion of electric cars tend to have more public charge points so a sustained and equitable rollout is essential.
For example, Hammersmith & Fulham doubled the number of electric cars in 2019 after announcing in 2018 that homes and business would be within 400 metres of a charging bay.
Appendix
Notes to Editors
- Recent analysis has shown that traffic congestion outside the city centre is now above 2019 levels https://europe.edf.org/news/2020/15/09/traffic-congestion-increasing-lo…
- Research has shown children without access to a car are 2.3 times more likely to walk there than those that do https://www.london.gov.uk/sites/default/files/health_impact_of_cars_in_…
- Cars have an annual cost to the NHS of £650 million per annum in London https://www.cleanairday.org.uk/files/press_release_-_health_costs_of_ca…
- Inner London boroughs performed well as part of the Healthy Streets Scorecard 2020 https://www.healthystreetsscorecard.london/
- 63% of potentially switchable private vehicle trips are wholly within outer London http://content.tfl.gov.uk/travel-in-london-report-11.pdf, p44-46
- Outer London has a 56% car mode share for commuting. http://content.tfl.gov.uk/mts-supporting-evidence-challenges-opportunit…, p11
- Average NOx emissions from Euro 5 and 6 diesel cars are approximately 6 times higher than the standards. https://www.trueinitiative.org/data/publications/remote-sensing-of-moto…;
- Transport for London has issued guidance to boroughs on workplace parking levies. https://tfl.gov.uk/info-for/boroughs-and-communities/workplace-parking-…
- The Healthy Streets Scorecard can be found here https://www.healthystreetsscorecard.london/
- Half of all car trips in London could be cycled in around ten minutes http://content.tfl.gov.uk/healthy-streets-for-london.pdf
- Real world emissions of diesel cars have shown to be up to 18 times worse than EU emission standards. https://www.trueinitiative.org/blog/2018/june/true-initiative-reveals-d…
- Analysis by Greenpeace showed that over half of diesel cars recently approved for sale in Europe are emitting pollutants far above current legal air pollution limits https://www.independent.co.uk/environment/diesel-cars-ban-cleanest-emis…;
- March and September are the peak months for sales of new cars, with new registration plates. https://www.smmt.co.uk/vehicle-data/car-registrations/
- Air pollution shortens the lives of Londoners leading to up to 9,400 extra deaths per year. https://www.londonair.org.uk/LondonAir/General/research.aspx#:~:text=Ai….
Data summary
- The full dataset for the index can be found here.
Car ownership per household is calculated as the total number of cars per borough divided by the projected 2019 household population.
The proportion of diesel cars is the number of diesel cars per borough, divided by the number of total cars per borough.
Electric cars include all cars of the following types: plug-in hybrid electric; battery electric; range-extended electric; fuel cell electric. The proportion of electric cars is the number of electric cars per borough, divided by the number of total cars per borough.